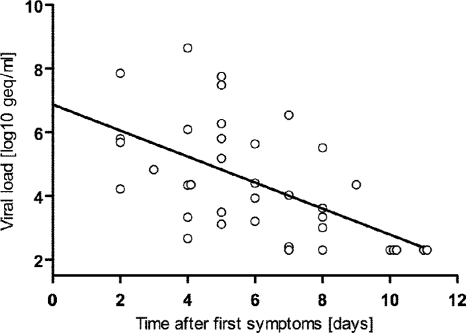
FIG. 3.
DENV loads and time from first symptoms. The viral load inversely correlated with the time between the start of the symptoms and the sampling (P = 0.00006; Spearman's rho test). A linear regression analysis was performed on the data set (slope, −0.41; y intercept, 6.88 log geq/ml; x intercept, 11.15 days; r2, 0.3368).

