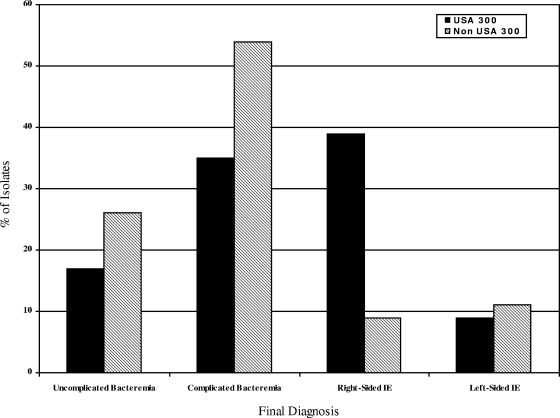
FIG. 1.
Distribution of USA 300 and non-USA 300 MRSA bloodstream isolates according to final diagnosis. The P value for overall comparison of the final diagnosis for USA 300 and non-USA 300 isolates is 0.02, which is statistically significant and corresponds to an FDR of <20%. “% of Isolates” refers to the percentage of isolates based on the total number of USA 300 and non-USA 300 isolates.

