FIG. 5.
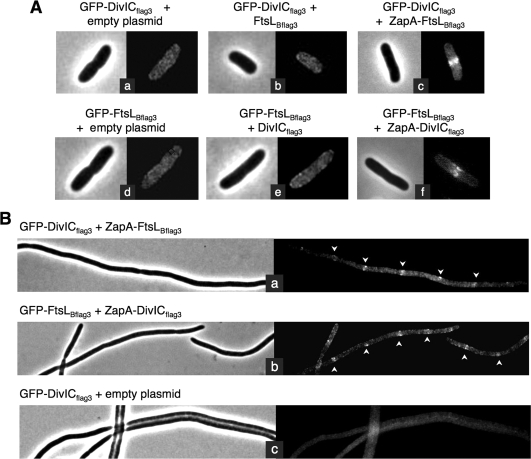
E. coli septal targeting of DivICflag3/FtsLBflag3 complex, tested in the absence of ZapA, fused to one of them or tested in an FtsQ depletion strain. (A) Fluorescence microscopy images showing subcellular localization of DivICflag3 and FtsLBflag3 GFP fusions when coexpressed with DivICflag3, FtsLBflag3, ZapA-DivICflag3, or ZapA-FtsLBflag3 or in cells carrying an empty plasmid. Strains CR275 (a), CR278 (b), CR211 (c), CR279 (d), CR280 (e), and CR213 (f) were grown at 30°C, and tested proteins were induced for 30 min with 20 μM IPTG. Samples were then prepared for microscopy as described in Materials and Methods. (B) Subcellular localization of GFP-DivICfllag3 and GFP-FtsLBflag3 when coexpressed with ZapA-FtsLBflag3 (a) and ZapA-DivICflag3 (b), respectively, or with ZapA-FtsB as a negative control (c) in an E. coli ftsQ-depleted strain. Strains CR253, CR257, and CR251 were depleted of FtsQ and complemented by the wild-type ftsQ gene carried on a pBAD plasmid and repressed in the presence of glucose. Cells expressed the GFP fusion from a pDSW204 plasmid, integrated on the chromosome, and ZapA fusions on a plasmid, after induction with 20 μM IPTG during 30 min at 30°C. Samples were prepared for microscopy as described in Materials and Methods, and phase-contrast and fluorescence microscopy images are shown for each strain. Arrows indicate some septal localizations in filaments.

