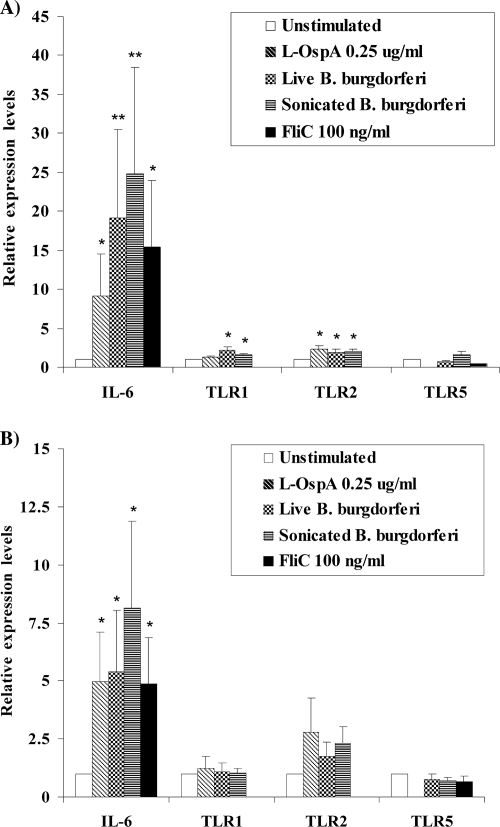
FIG. 1.
Relative expression of IL-6 and TLR1, -2 and -5 transcripts in microglia and astrocytes in response to specific TLR ligands and B. burgdorferi. Microglia (A) and astrocytes (B) were treated with L-OspA, live and sonicated B. burgdorferi cells (MOI of 10), and FliC for 8 h. The expression of each TLR transcript was determined using qRT-PCR, and each transcript was normalized with respect to the expression of GAPDH. Presented are the mean values obtained from triplicate specimens ± standard deviations. Asterisks indicate a significant difference between unstimulated and stimulated cells: * and **, P < 0.05 and P < 0.005, respectively. Similar results were obtained with microglial RNA obtained from three additional rhesus monkeys and astrocyte RNA from four additional animals.

