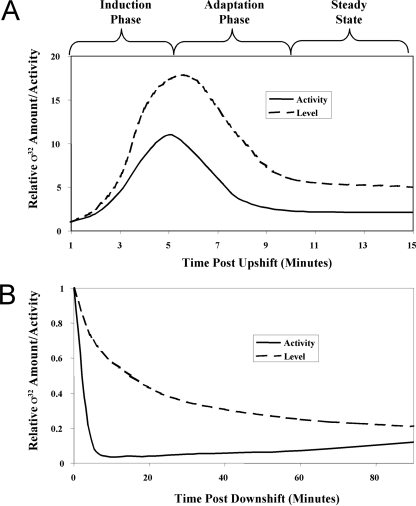
FIG. 1.
Activation and repression of the HSR during temperature upshift and downshift. (A) Activation of the HSR during a temperature shift from 30 to 42°C reveals three distinct phases: induction, adaptation, and steady state. (B) Repression of the HSR during a temperature shift from 42° to 30°C. The relative σ32 activities measured by HSP synthesis are shown by the solid lines; relative σ32 levels measured by Western blotting analysis are shown by the dotted lines.

