
Figure 1. Sedimentation assay of tropomyosin binding to actin.
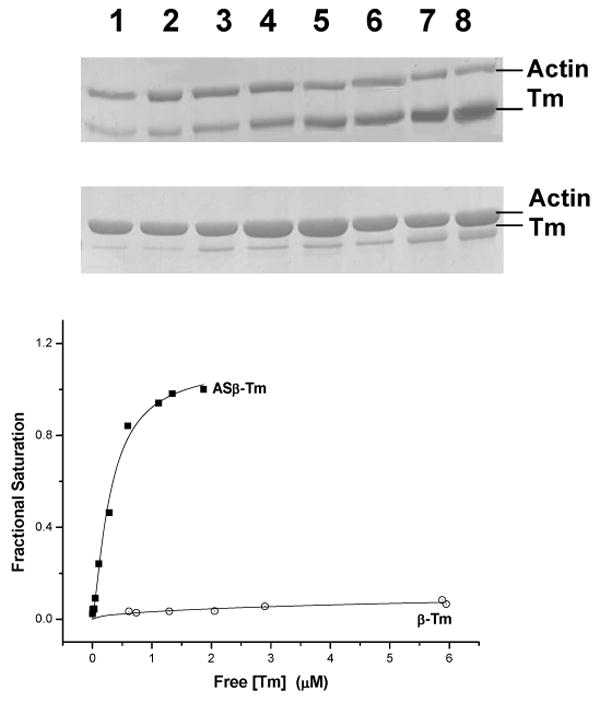
A) 10 μM actin and different β-Tm concentrations (0.5 – 7.0 μM) were spun at 100000 g and the supernatants (upper gel) and pellets (lower gel) analysed by SDS-PAGE.
B) Analysis of the fraction of β-Tm binding to actin from the relative band densities Binding constants (K50%).the fraction of Tm bound to actin was estimated from the density of the bands in the pellet and plotted against the free Tm concentration. The fitted line is the least squares best-fit to the Hill Equation. Conditions: 100 mM KCl, 5 mM MgCl2, 20 mM MOPS, pH 7.0, 20° C.