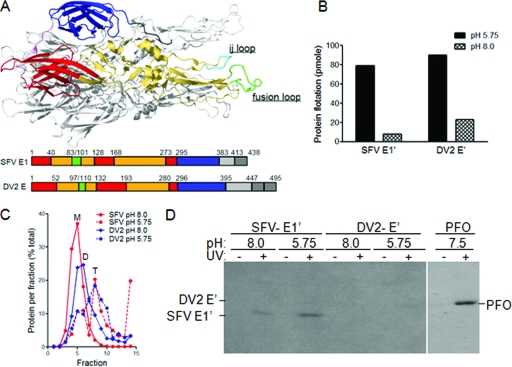
FIG. 4.
Photoaffinity labeling reveals the specific cholesterol interaction of the SFV but not DV2 fusion protein. (A) Fusion protein structure and schematics. The structure of the SFV E1*HT is shown with one monomer in color and the others in gray. The color monomer shows the positions of the three domains (red, DI; yellow, DII; and blue, DIII), the fusion peptide (green), and the ij loop (cyan). Linear representations of the E1 and E sequences are shown below the structure. (B) Liposome coflotation of SFV E1′ and DV2 E′. E1′ and E′ proteins were mixed with liposomes containing [3H]photocholesterol and treated at the indicated pH for 30 min at 25°C. Aliquots of the samples were tested for liposome binding by analysis on sucrose flotation gradients. The protein-liposome mixture was loaded on the bottom of a sucrose step gradient and centrifuged to float the liposomes to the top of the gradient. The proteins in the top and bottom fractions were quantitated by SDS-PAGE and Western blotting, and the total liposome-bound protein in each sample was calculated. (C) Formation of SFV E1′ and DV2 E′ homotrimers. Aliquots of the samples described in the legend for panel B were tested for trimerization of the fusion protein by solubilization with 1% β-OG, analysis on sucrose sedimentation gradients, and quantitation as for Fig. 4B. Sedimentation is to the right, and the positions of the SFV E1′ monomer (M), the DV2 E′ dimer (D), and the SFV and DV homotrimers (T) are indicated. (D) Photoaffinity labeling of SFV E1′ and DV2 E′. Aliquots of the samples were exposed to UV light for 20 min as indicated, acid precipitated, washed with acetone, and analyzed by SDS-PAGE and fluorography. In a separate reaction mixture, purified PFO was incubated at 37°C for 10 min with liposomes containing [3H]photocholesterol, exposed to UV light, and analyzed as above. Panels B to D are representative examples of two independent experiments.

