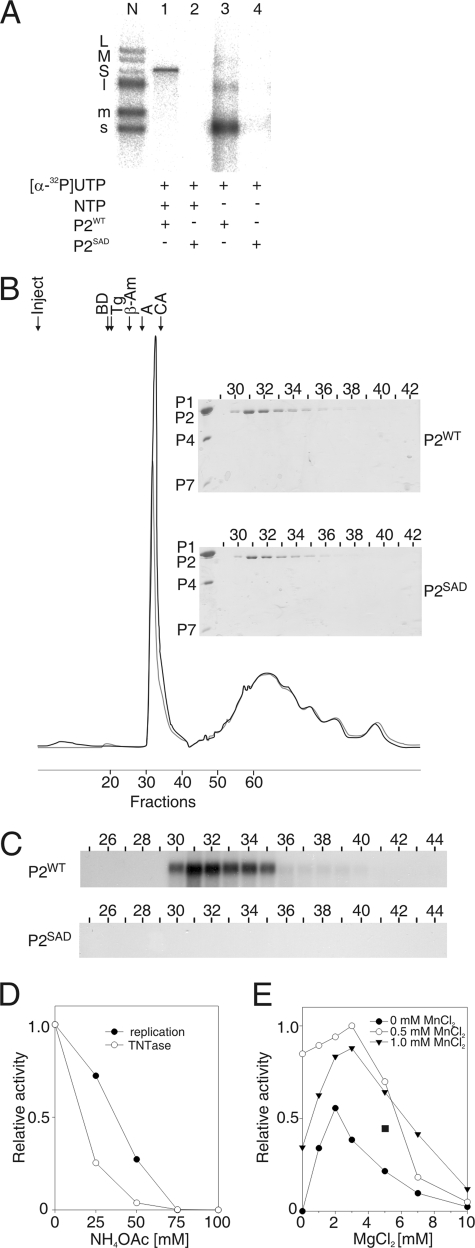
FIG. 1.
Purified φ6 P2 polymerase catalyzes the transfer of an α-phosphate from a donor UTP to an acceptor ssRNA molecule. (A) Native agarose gel electrophoresis of reactions with purified P2WT and P2SAD assayed under standard polymerization reaction conditions in the presence of [α-32P]UTP and a single-stranded φ6 s+ segment. The reactions were carried out with or without unlabeled NTPs as indicated. The positions of the labeled single-stranded (s+, m+, and l+) and double-stranded (S, M, and L) φ6 genome segments produced by nucleocapsid transcription (41) are shown on the left (lane N). (B) Absorbance (A280) elution profile of P2WT and P2SAD separated on a Superdex 200 gel filtration column (Amersham Biosciences). The arrows indicate the P2 injection time (Inject) and the position of selected gel filtration molecular mass markers (Sigma): BD, blue dextran (2,000 kDa); Tg, thyroglobulin (669 kDa); β-Am, β-amylase (200 kDa); A, albumin (66 kDa); and CA, carbonic anhydrase (29 kDa). The lower peak corresponds to nonionic detergents of the P2 storage buffer. (Insert) Sodium dodecyl sulfate-polyacrylamide gel analysis of the protein content in fractions 29 to 42 (upper panel, P2WT; lower panel, P2SAD). φ6 polymerase complex proteins (P1, P2, P4, and P7) are marked on the left. (C) Enzymatic activity in Superdex 200 fractions 25 to 44 of P2WT (upper panel) and P2SAD (lower panel) with s+13+ ssRNA template and [α-32P]UTP (in the absence of other NTPs). (D and E) Effect of the reaction conditions on the α-32P transfer activity of φ6 P2. The RNA products of the reaction mixtures containing sΔ+13+ ssRNA were separated by electrophoresis in a native agarose gel and analyzed by phosphorimager quantification. The graphs are normalized to the highest value (1) within each panel. The effect of the NH4OAc concentration on α-32P transfer activity is shown in panel D together with the replication activity under the same conditions for comparison. The MnCl2 and MgCl2 concentration effects are shown in panel E. The α-32P transfer activity under the optimal replication reaction conditions (2 mM MnCl2 and 5 mM MgCl2) is indicated by a filled square.

