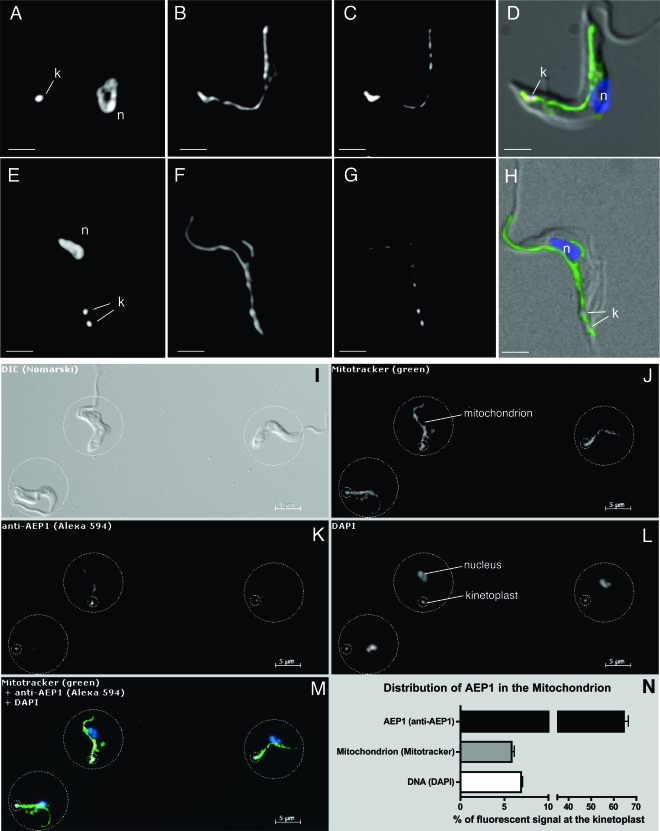
FIG. 2.
Analysis of the distribution of AEP-1 in bloodstream form trypanosomes using immunofluorescence microscopy. (A to H) Immunofluorescence microscopy of whole cells using the DNA stain DAPI (A and E), the mitochondrial marker MitoTracker (B and F), and an antibody to AEP-1 (C and G). Panels D and H show the merged images of panels A to C and panels E to G, respectively, using artificial coloring (blue, A and E; green, B and F; red, C and G) with a differential interference contrast image. (I to N) Fluorescence microscopy showing the distribution of AEP-1 in the mitochondrion of bloodstream form T. brucei. Shown is a representative field of T. brucei cells following incubation with MitoTracker FM green that was subsequently fixed and stained for AEP-1. (I) Differential interference contrast (DIC) image of bloodstream form T. brucei. (J) Fluorescence image (excitation, 490 nm; emission, 516 nm) of the same cells showing MitoTracker signal. (K) Fluorescence image of the same cells (excitation, 590 nm; emission, 617 nm) stained with anti-AEP-1 antibody. (L) Cells stained with DAPI. (M) Overlay of images J to L using artificial colors: green, MitoTracker; red, AEP-1; blue, DAPI. (N) Quantitation of signal distribution over 38 individual cells. Relative distribution of the individual channels between the large and small circles was measured, and the average and standard deviations are displayed in the graph. The small circle (diameter, 2 μm) was centered at the kinetoplast. The large circle was chosen to contain the entire signal from a given cell in each channel. The positions of the kinetoplast (k) and nucleus (n) are indicated.

