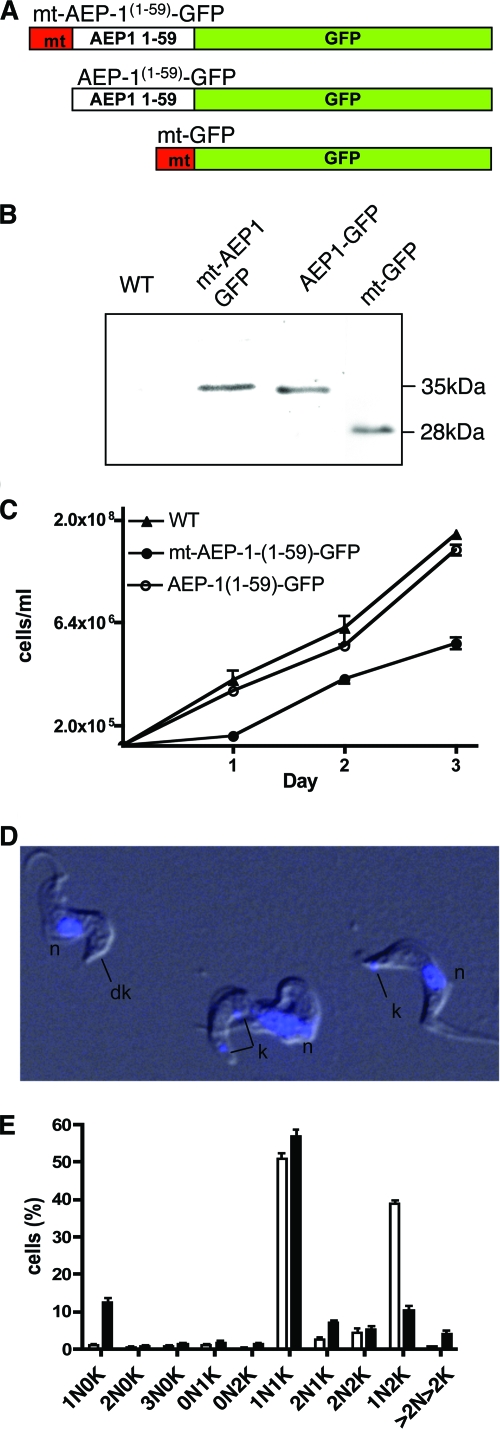
FIG. 4.
Expression of a truncated AEP-1 produces a dominant negative phenotype. (A) Representation of the AEP-1(1-59)-GFP construct with and without the N-terminal mitochondrial targeting sequence (mt; red) and a GFP (green) with the mitochondrial targeting sequence. (B) Western blot analysis of total protein extract from 1 × 10⁵ wild-type (WT) and transfected cells with anti-GFP. (C) Growth of transfected and WT cells. (D) Overlay of differential interference contrast image and DAPI-stained image of AEP-1(1-59)-GFP-transfected cells (n, nucleus; k, kinetoplast; dk, dyskinetoplast) (for the full field, see Fig. S4 in the supplemental material). (E) Histogram from seven independent experiments. A total of 1,037 wild-type cells and 887 mt-AEP-1(1-59)-GFP-transfected cells were analyzed for numbers of nuclei (N) and kinetoplasts (K) using DAPI staining. Cells are classified as, for example, 1N0K, indicating one nucleus and no kinetoplast.

