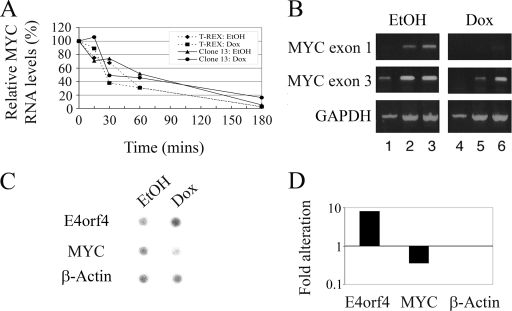
FIG. 5.
Investigation of the mechanisms underlying E4orf4-induced MYC downregulation. (A) T-REX and clone 13 cells were treated with 1 μg/ml doxycycline (Dox) or with ethanol (EtOH) vehicle for 5 h. Actinomycin D was then added (5 μg/ml), and cells from two plates per each point were harvested at the indicated times after the addition of the drug. RNA was prepared and subjected to quantitative real time PCR analysis with primers to MYC and the housekeeping GAPDH gene. Relative quantification was obtained by normalizing MYC results to GAPDH levels. The values at the time of addition of actinomycin D (time zero) were defined as 100% for each group of treated cells. Broken line with diamonds, T-REX with EtOH treatment; broken line with squares, T-REX with doxycycline treatment; solid line with triangles, clone 13 with EtOH treatment; solid line with circles, clone 13 with doxycycline treatment. (B) RNAs were extracted from clone 13 cells treated with ethanol or 1 μg/ml doxycycline for 6 h and were subjected to semiquantitative RT-PCR analysis with primers to MYC exon 1 or 3 and to GAPDH. Amplified cDNAs were taken for agarose gel analysis after 21 (lanes 1 and 4), 24 (lanes 2 and 5), and 27 (lanes 3 and 6) amplification cycles for the MYC reactions and after 17 (lanes 1 and 4), 22 (lanes 2 and 5), and 25 (lanes 3 and 6) amplification cycles for the GAPDH reaction. (C) Clone 13 cells were treated with ethanol or 1 μg/ml doxycycline for 6 h, and nuclei were prepared and subjected to nuclear run-on analysis. Hybridization of the 32P-labeled RNA products to a filter carrying DNA sequences of E4orf4, MYC, and β-ACTIN was visualized by use of a PhosphorImager. (D) Results of C were quantified using TINA software. The alteration shown here using a logarithmic scale is the ratio between intensities of hybridization for doxycycline- and EtOH-treated cells normalized to the ratio for the control β-ACTIN gene.

