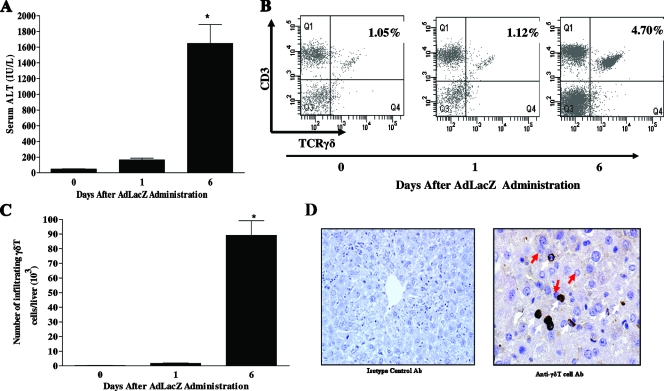
FIG. 1.
Kinetics of acute liver damage and hepatic γδT-cell accumulation following AdLacZ administration. (A) C57BL/6 mice were given vehicle or infected with AdLacZ. Serum was collected at the indicated times and used to measure ALT levels (as described in Materials and Methods). Data are shown as means ± SEM (n = 5 to 8 mice per group; *, P ≤ 0.05 versus uninfected group, i.e., day 0). (B and C) To determine γδT-cell accumulation in the livers of C57BL/6 mice systemically challenged with AdLacZ or vehicle, hepatic lymphoid cells were isolated at the indicated times, stained with specific fluorochrome-labeled TCRγδ and CD3 MAbs, and then analyzed by flow cytometry to reveal the percentages (B) and absolute numbers (C) of γδT cells (i.e., TCRγδ-CD3 double-positive T cells) per liver. Data are presented as means ± SEM (n = 5 or 6 mice per group; *, P ≤ 0.05 versus uninfected group, i.e., day 0). (D) To reveal the localization of γδT cells in the liver, frozen liver sections were obtained from AdLacZ-infected C57BL/6 mice 6 days after infectivity and immunohistochemical localization of γδT cells was performed. Liver sections were stained with isotype control Ab or anti-γδT-cell Ab. γδT cells (white arrows) and hepatocytes (red arrows) are shown. Original magnification, ×400.

