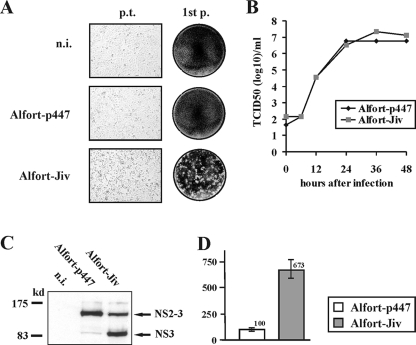
FIG. 2.
Characterization of CSFV Alfort-Jiv in vitro. (A) Cytopathogenicity of Alfort-Jiv. (Left column) SK-6 cells were either mock transfected (top) or transfected with synthetic Alfort-p447 (middle) or Alfort-Jiv RNA (bottom). Twenty-six hours posttransfection, a CPE was detectable only in cells transfected with Alfort-Jiv RNA. (Right column) Cell culture supernatants from transfections were used to perform plaque assays. Six days p.i., plaques were visible only in cells infected with supernatant from cells transfected with Alfort-Jiv RNA. (B) Growth curves of cp CSFV Alfort-Jiv and non-cp CSFV Alfort-p447. Growth kinetics were determined on SK-6 cells infected at an MOI of 0.5. Titers of released virus were determined over a 2-day period at the indicated time points. (C) Immunoblot analysis of NS2-3 cleavage. SK-6 cells were infected with Alfort-p447 or Alfort-Jiv at an MOI of 1 and lysed 27 h p.i. The samples were subjected to sodium dodecyl sulfate-polyacrylamide gel electrophoresis under reducing conditions, transferred onto a nitrocellulose membrane, and analyzed by using anti-NS3 MAb 8.12.7. Marker proteins are indicated in kilodaltons on the left. The positions of NS2-3 and NS3 are indicated on the right. Note the large amount of NS3 detected from cells infected with Alfort-Jiv. n.i., noninfected SK-6 cells. (D) Relative amounts of accumulated viral genomic RNAs obtained 24 h after infection of SK-6 cells with CSFV Alfort-p447 and Alfort-Jiv at an MOI of 0.5. The graph shows mean values and standard deviations (error bars) obtained by quantitative real-time RT-PCR analysis, including the measurements of three independent replicates. The amount of CSFV RNA measured in cells infected with reference strain Alfort-p447 was set to 100%.

