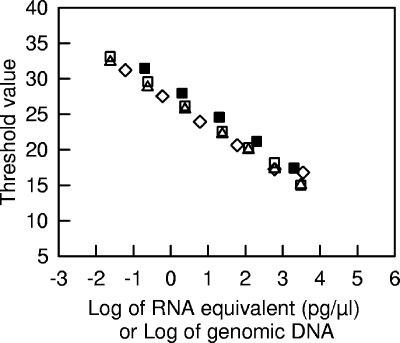
FIG. 1.
Standard curve analyses of tuf amplification for genomic DNA (▪), RNA (⋄), cDNA (▵), and cDNA from DNase-treated RNA (□) dilution series. RNA and genomic DNA were extracted from cheese incubated for 15 h at 30°C. For the DNA standard curve, various dilutions of the DNA sample were directly analyzed by real-time PCR. For the RNA standard curve, various amounts of RNA were reverse transcribed and analyzed by real-time PCR after 25-fold dilution. For the two cDNA standard curves, reverse transcription was done using an RNA concentration of 15 ng/μl, and various dilutions were then analyzed by real-time PCR.

