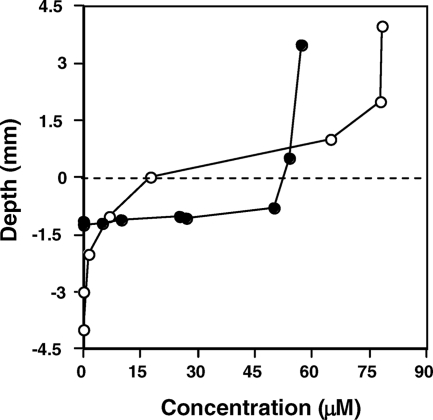
FIG. 2.
Vertical H2S and O2 gradients in the microbial mats. Cyclic voltammetry was used to estimate H2S concentrations in the center of the outflow channel approximately 100 cm downstream of the spring source, as shown by filled circles (•). The vertical profile of dissolved O2 at a point 100 cm downstream of the spring source is shown by open circles (○). A dashed line represents the approximate upper boundary of the microbial mat.

