
FIG. 1.
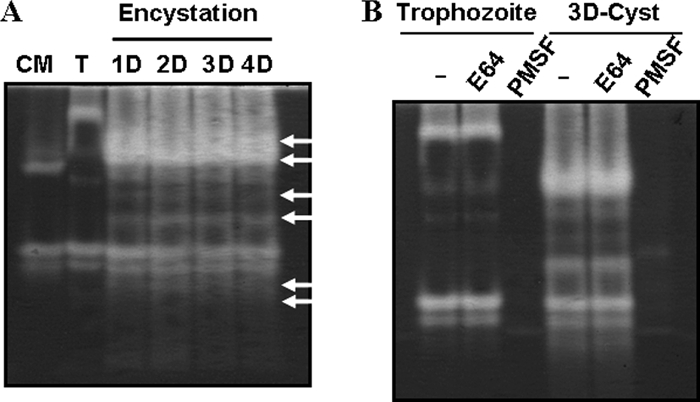
Gelatin zymogram analysis comparing the proteinase activities during encystation. The patterns of total proteolytic activity within culture media (CM), trophozoite (T), and cyst cell lysates (Day 1 [1D], 2D, 3D, and 4D) were compared by gelatin zymogram analysis (A). Arrows indicate new proteolytic bands that appear during encystation. Almost all proteolytic activity, induced by encystations, was inhibited by the serine protease inhibitor PMSF (B).