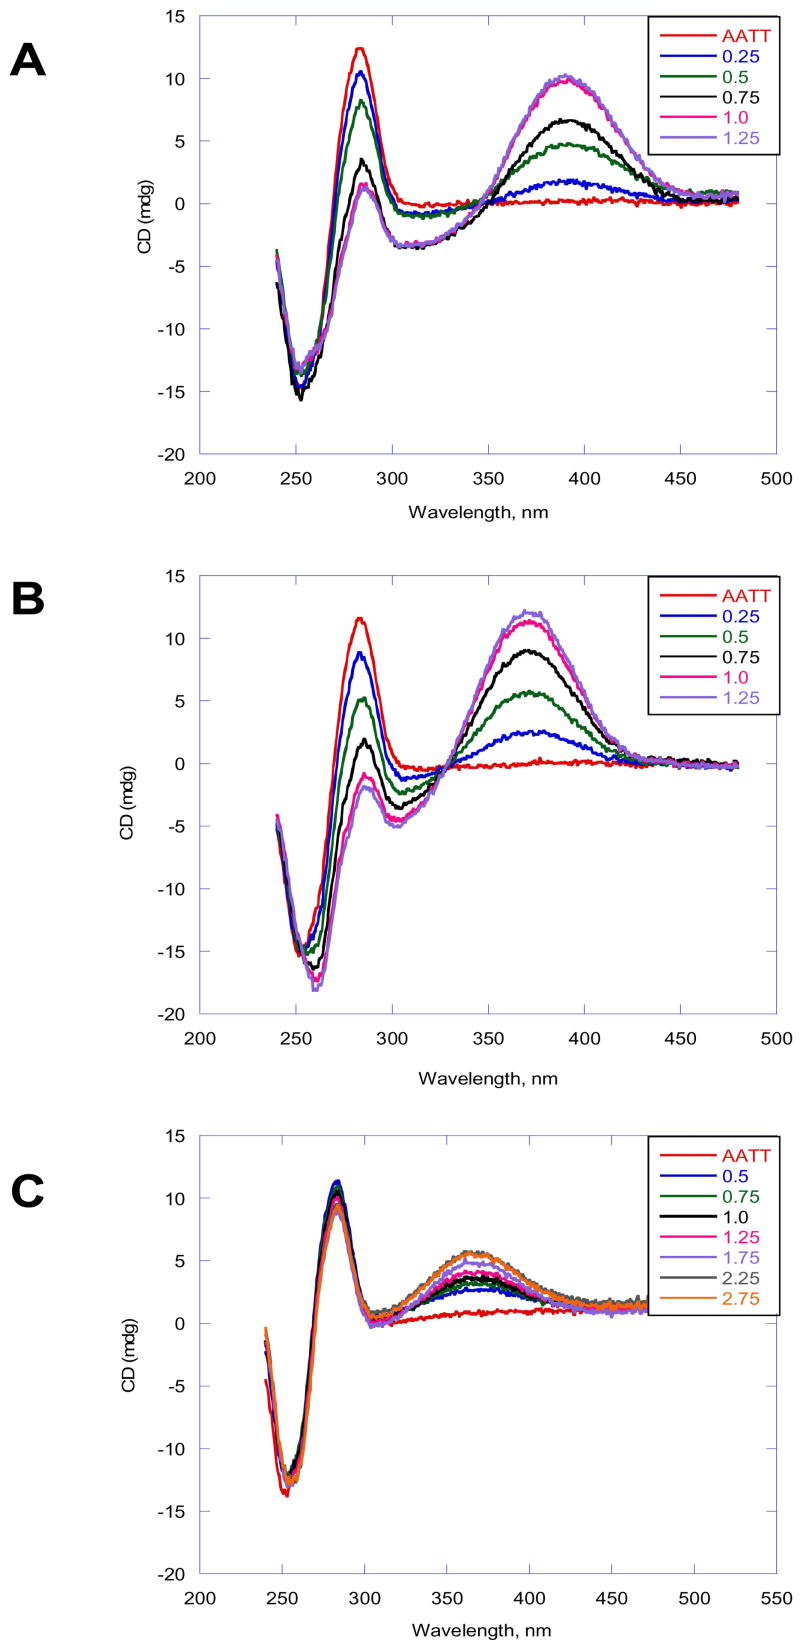
Figure 3.
CD spectra of DB884, DB613 and DB890 with d(GCGAATTCGC)2. (A) In DB884 the ratios of the compound to DNA from the bottom to the top at 375 nm 0, 0.25, 0.5, 0.75, 1.0 and 1.2. (B) In DB613 the ratios of compound to DNA are 0, 0.25, 0.5, 0.75, 1.0 and 1.2. (C) In DB890 the ratios of compound to DNA are 0.5, 0.75, 1.0, 1.25, 1.75, 2.75. The experiments were conducted in cacodylic acid buffer at 25 °C.

