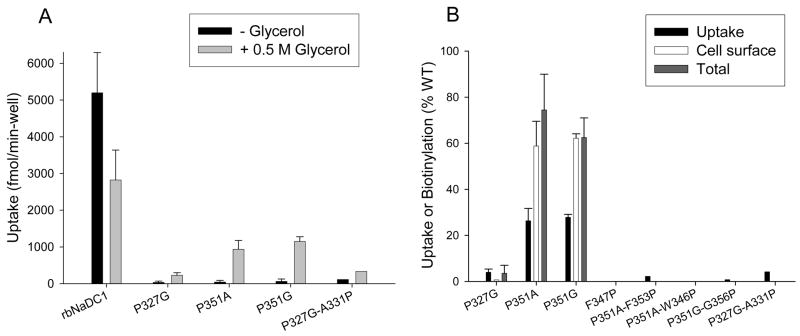
Figure 5.
Effect of glycerol on TM 7 mutants (A) Transport of 100 μM 3H-succinate in wild-type and mutant rbNaDC1 with and without addition of 0.5 M glycerol. Results are means ± range or S.E.M (n = 2 or 3). The P327G-A331P result is from a single experiment. (B) Comparison between transport activity and cell surface expression of TM 7 mutants after addition of glycerol. Transport activity, cell surface and total protein biotinylations were measured. Intensities of the protein bands were quantitated using Image 1D software. The data are expressed as a percentage of wild-type control in each experiment. Results are presented as mean ± range (n = 2) for mutants P327G, P351A and P351G and only mean is indicated for all other mutants (n =1).

