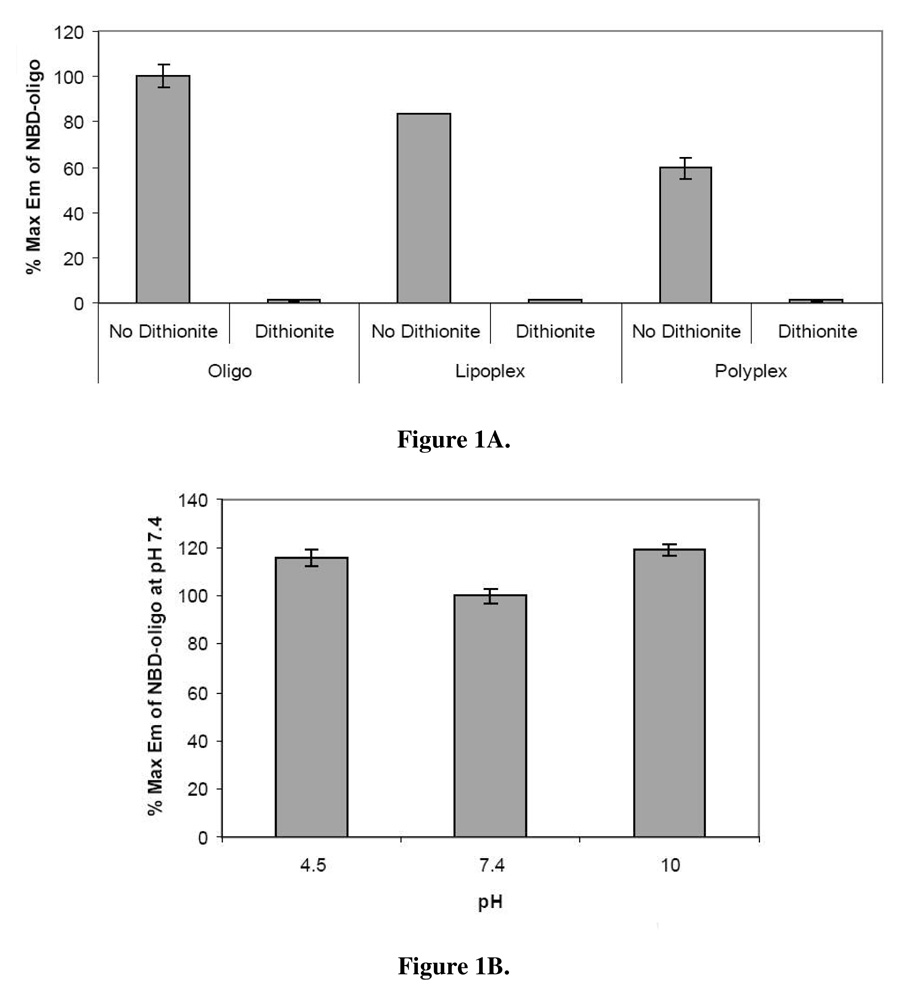
Figure 1. Effect of dithionite treatment and pH on NBD fluorescence emission intensity.
(A) Fluorescence emission of NBD-labeled oligos and lipid- and polymer-based gene carriers incorporating NBD-labeled oligos was measured in the presence and absence of dithionite. Values are presented as the percentage fluorescence emission compared to an equivalent amount of uncomplexed, unquenched NBD-oligo ± standard deviation. (B) Fluorescence emission of NBD-oligos was measured in acidic, neutral, and basic buffers. Values are presented as the percentage fluorescence emission compared to an equivalent amount of NBD-oligo in PBS (pH 7.4) ± standard deviation.

