
Figure 3.
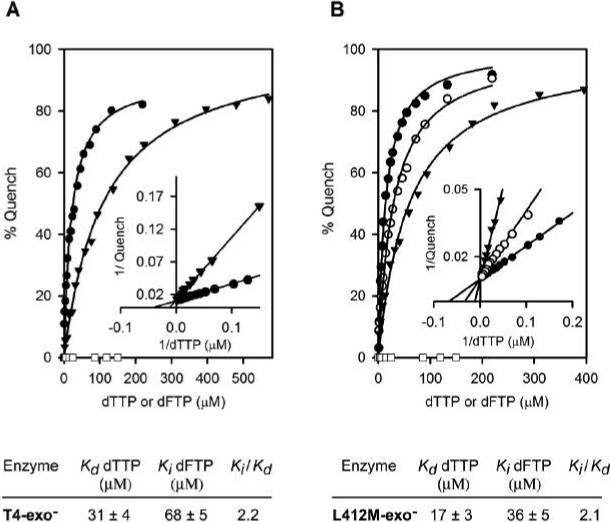
Nucleotide binding assays. Formation of ternary Enzyme-DNA-dNTP complexes with T4-exo− (A) and L412M-exo− (B) were measured as a function of dTTP concentration using the chain-terminated DNA substrate illustrated in Figure 1A. 10 mM MgCl2 was present. dTTP binding quenches 2AP fluorescence in a concentration-dependent manner (•), but dFTP does not at the concentrations tested (□); however, dFTP at 50 (○) and 150 μM (▼) reduced the ability of dTTP to quench 2AP fluorescence. Equilibrium dissociation constants (Kds) for dTTP binding were determined by fitting the data (solid line) to the hyperbolic equation, q = [Q] [dTTP]/Kd + [dTTP], where q is the observed fluorescence quench at various dTTP concentrations and Q is the maximum fluorescence quench observed at saturating dTTP. Kis for dFTP were determined in dTTP binding reactions with either 50 or 150 μM dFTP; dFTP was a competitive inhibitor of dTTP binding as demonstrated by the Lineweaver-Burk plots (insets). Kd values for dTTP binding and Ki values for dFTP for T4-exo-− and L412M-exo− are given below the quench curves.