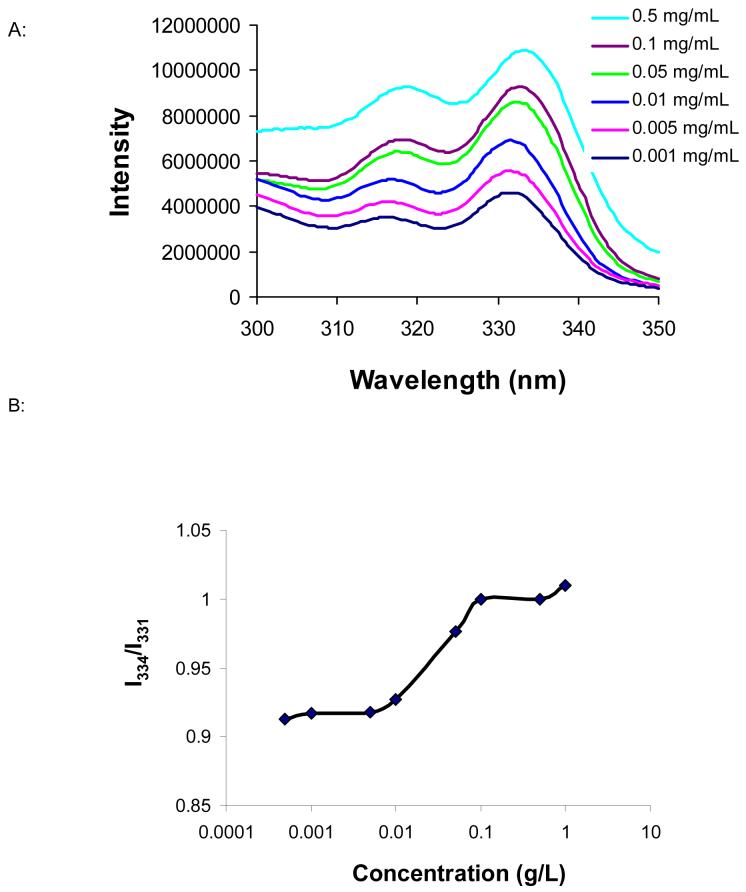
Fig. 4.
(A): Excitation spectra of pyrene as a function of copolymer concentration in water. For reasons of clarity, spectra at copolymer concentrations of 0.0005 and 1.0 mg/mL were omitted from the plot. (B): Plot of excitation intensity ratio at I334/I331 against logarithm of copolymer concentration. The experiment was performed with emission wavelengths of 393 nm. The CMC measured was 12 mg/L.

