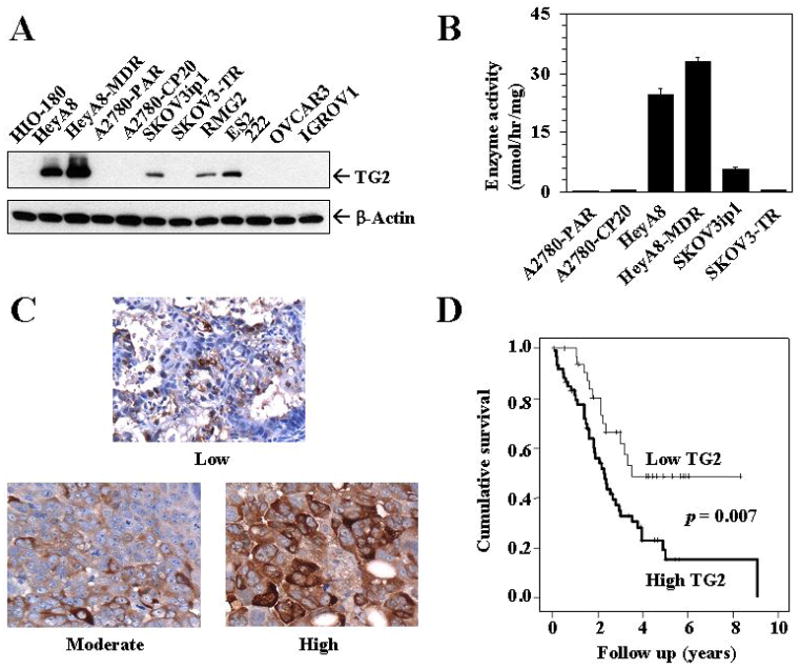
Figure 1.

A) Western blot showing basal expression of TG2 protein in 11 ovarian cancer cell lines and one non-transformed normal ovarian epithelial cell line (HIO-180). B) Transglutaminase enzymatic activity according to TG2 expression levels. Mean enzymatic activity of TG2 was determined in the cell extract by studying Ca2+-dependent incorporation of [3H]putrescine into dimethylcasein, as described in Materials and methods. Error bars represent S.D. C) Representative immunohistochemical staining of clinical specimens for TG2 expression. All pictures were taken at original magnification × 200. D) Kaplan–Meier survival curve of patients with invasive ovarian cancer according to TG2 expression.
