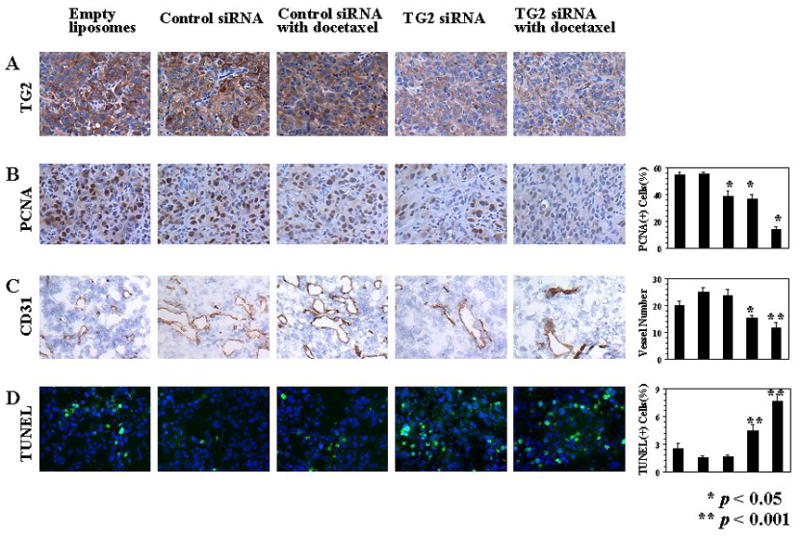
Figure 5.

A) Effects of TG2-targeted therapy on TG2 expression (TG2; original magnification × 100); B) proliferation (PCNA; original magnification × 100); C) microvessel density (CD31; original magnification × 100), and D) apoptosis (green nuclei by TUNEL staining; blue nuclei by Hoechst; original magnification × 200). The graphs correspond to the labeled columns for immunohistochemistry. Error bars represent S.D.
