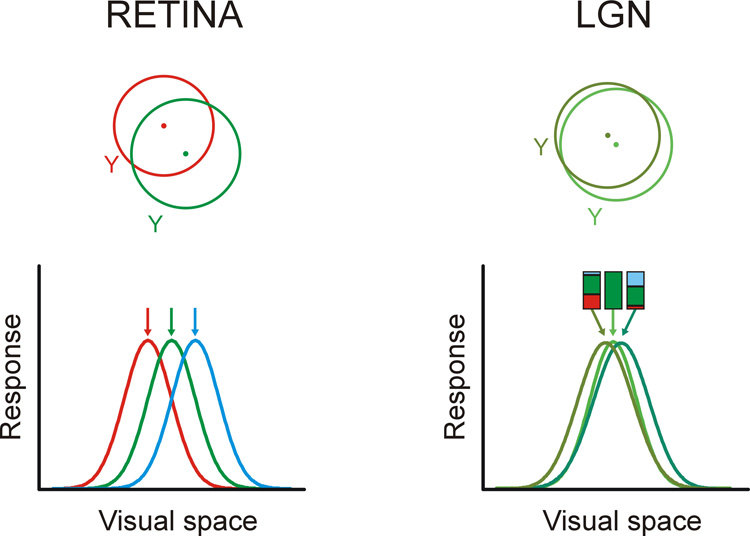
Figure 6. Multiplexing the receptive field positions of retinal inputs in LGN.
Top. The cartoon illustrates the receptive fields of two neighboring Y cells in the cat retina (based on Mastronarde, 1983) and two neighboring Y cells in cat LGN (based on Weng et al., 2005). Bottom left. The receptive fields of three Y cells in the retina are represented as gaussian curves in three different colors. Bottom right. The combination of the three retinal inputs yields LGN receptive fields that can sample stimuli at a finer spatial resolution than in the retina. The bar graphs at the top illustrate the relative weights of the retinal inputs that were used to generate the LGN gaussians.

