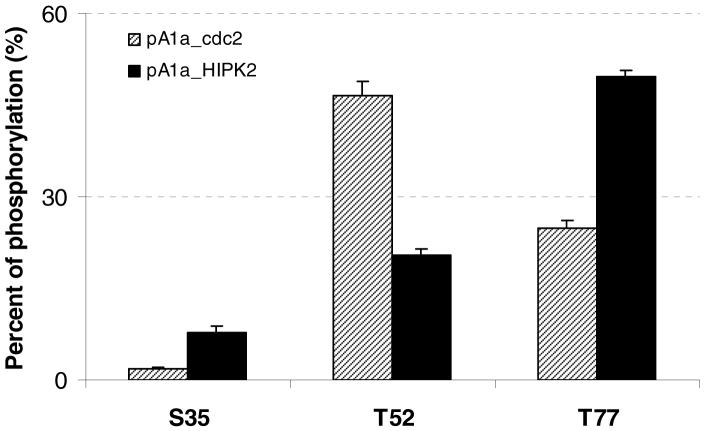
Figure 2.
Histograms showing that HIPK2 and cdc2 exhibit different site preferences on the in-vitro phosphorylation of HMGA1a. Phosphorylations mediated by HIPK2 (“pA1a_HIPK2”) and cdc2 (“pA1a_cdc2”) are represented by black and shaded bars, respectively. The level of phosphorylation of each modified residue was quantified by using LC-MS/MS (see Materials and Methods). The data represent the means and standard deviations of results from three independent measurements.

