
Fig. 3.
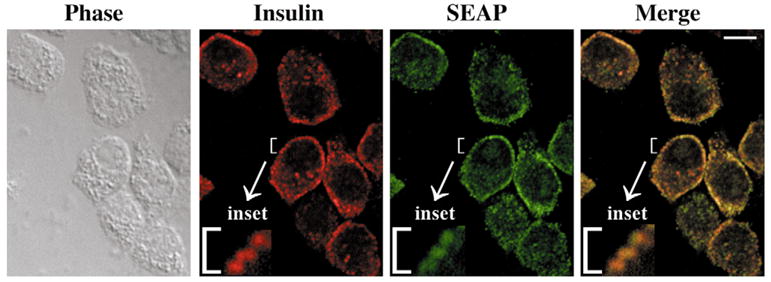
Phase-contrast microscopy and confocal indirect immunofluorescence distribution of insulin and SEAP in transfected INS-1 β-cells. Insulin secretory granules tend to concentrate in a subplasmalemmal distribution and are not found in the stippled areas seen by phase contrast. All cells in the clonal population express SEAP (green), which exhibits large areas of overlapping distribution with that of insulin (red). A small bracket in each fluorescence image encloses three puncta that are thought to represent subplasmalemmal secretory granules or granule clusters. The bracketed area is reproduced as an inset at higher magnification in the lower left corner of the merged image to highlight the degree of colocalization of SEAP and insulin. Bar, 10 μm.