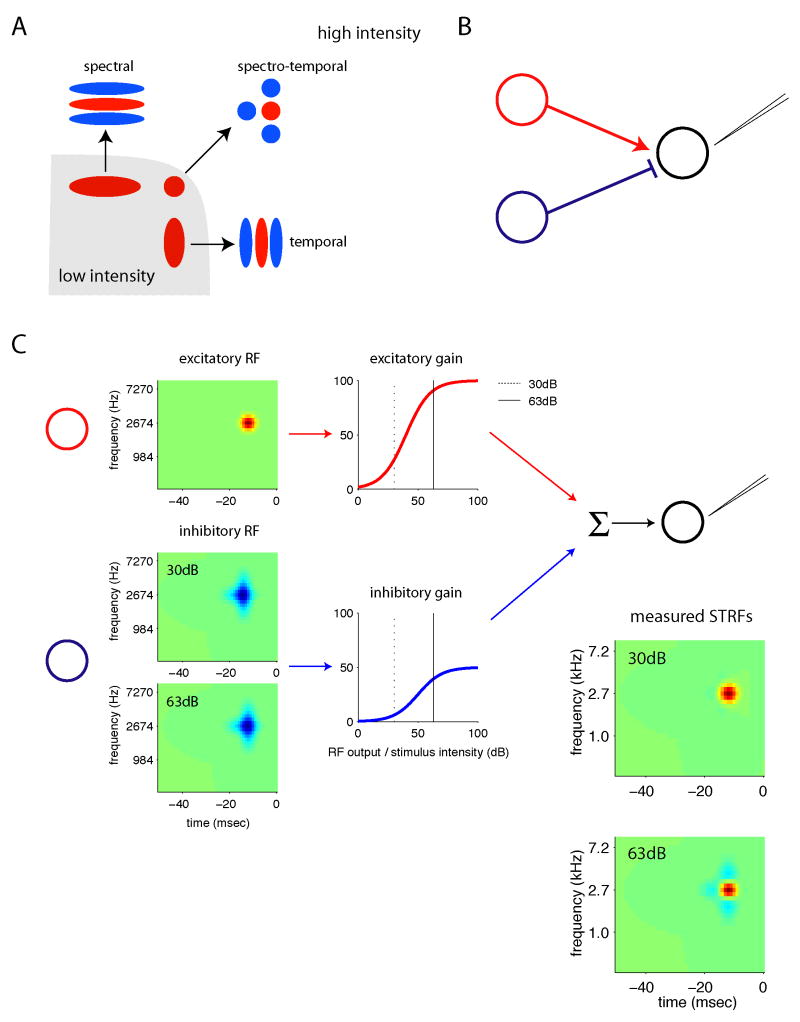
Figure 9. A model of STRF dependence on intensity.
A) Schematic summary of auditory encoding in field L across intensities. At low stimulus intensities (gray region), STRFs are dominated by large positive regions that can be elongated in time or frequency. These STRFs behave as “detectors” responding whenever there is sound energy present within the receptive field. At high stimulus intensities (white region), negative regions oriented in time, spectrum, or both, appear. These ensure that cells only respond when the energy in the positive region of the STRF is greater than that at nearby frequencies or times, making cells more selective for differences or changes in their preferred dimension.
B) A simple biophysical model can account for the dependence of STRFs on stimulus intensity. In this model, the cell we are recording from (or some cell upstream from it; shown in black) receives at least two inputs, one excitatory (red) and one inhibitory (blue).
C) In this model, the response properties of the output neuron (black) can be modeled as the sum of the nonlinear responses of its excitatory (red) and inhibitory (blue) inputs. The response of each input neuron is calculated by convolving its receptive field (first column) with the stimulus, summing, then nonlinearly transforming the output of the receptive fields according to a nonlinear gain function (second column). The STRF measured for the output neuron will reflect a weighted sum of the two input receptive fields. Each receptive field is weighted by the slope of its gain function in the region explored by the stimulus. Because stimuli with different mean intensities explore different regions of the gain function (vertical lines), the STRF will reflect different combinations of excitatory and inhibitory inputs at 30 and 63dB.

