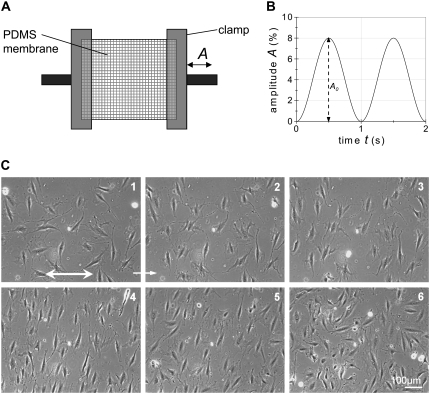
FIGURE 1.
(A) Schematic drawing of the experimental setup. An elastic membrane is clamped and periodically elongated in x direction with the time-dependent amplitude A. The time-course of A is given in (B) as an example with the maximal amplitude A0 = 8% and a frequency f = 1 s−1. (C) Light microscopy image sequence of REF cells adhering to a cyclically stretched substrate at strain amplitude A = 8% and strain frequency f = 10 s−1. Each image corresponds to a particular time, t, after the start of stretching: 1 (t = 0); 2 (t = 30 min); 3 (t = 100 min); 4 (t = 500 min); 5 (t = 625 min); 6 (t = 1050 min). The substrate was stretched in the x-direction (double arrow in image 1). After 500 min (4) the applied stretch was stopped and the subsequent relaxation was observed (5 and 6). The cell number increases in the course of the experiments due to cell division and the cells migrate (see Movie S1).

