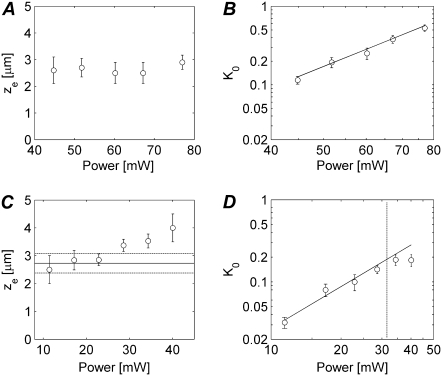
FIGURE 4.
(A) Two-photon FRAP experiments were performed on FD500 in an 85% (w/w) glycerol solution by bleaching a disk of 3 μm in radius with different laser powers to evaluate the axial extension ze of the effective photobleaching PSF. The axial bleaching resolution was determined by fitting of the two-photon disk FRAP model to the experimental recovery curves. Every data point is the average of 10 measurements. The error bars are the corresponding standard deviations (SDs). (B) The corresponding K0 values are shown as a function of the bleaching laser power in a log-log plot. The slope of the linear fit is 2.7. (C) The same measurement was performed on paGFP in a solution containing 56% (w/w) of sucrose. The horizontal solid line represents the average of the ze values corresponding to a laser power ≤25 mW. The dashed lines indicate the corresponding SD. (D) A log-log plot of K0 as a function of the photoactivation laser power is shown. The solid line is a linear fit to the data at the left of the vertical dashed line, having a slope of 1.8.

