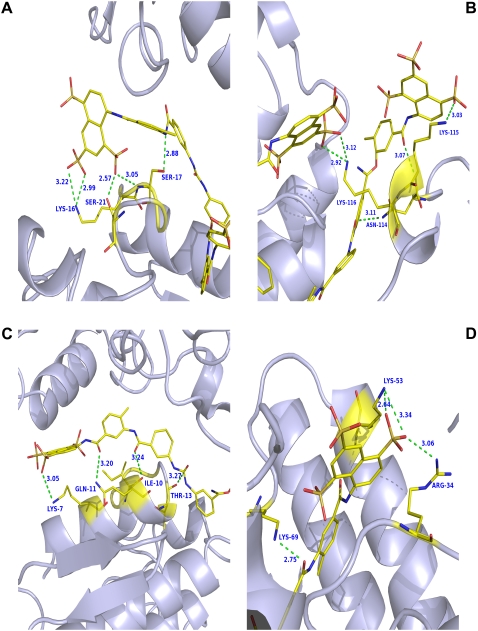
FIGURE 8.
Comparison of interaction region of suramin with ecarpholin S and Basp-II. (A) Suramin interacts with i-face region of ecarpholin S. (B) Suramin interacts with C-terminal region of ecarpholin S. (C) Suramin interacts with N-terminal region of ecarpholin S. (D) Suramin interacts with putative Ca2+-binding loop region of Basp-II (Protein Data Bank code, 1Y4L). Hydrogen bonds are shown in green (dashed lines). Images were prepared using the program Pymol (59).

