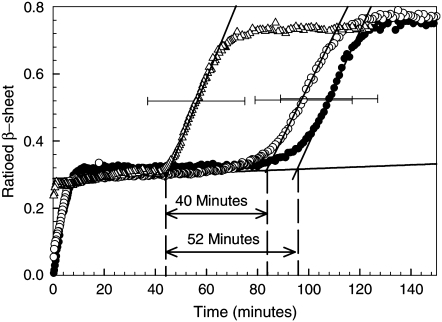
FIGURE 4.
Fibril nucleation studies in BPI solutions (20 mg mL−1, pH 1) with different thermal histories. Data are shown for the ratioed β-sheet growth kinetics obtained from FTIR spectroscopy measurements of BPI solutions (see text). The data were collected from freshly dissolved BPI solutions that were incubated at 60°C (•), as well as solutions that were heated to 60°C for 60 min before being quenched to 25°C and then reheated to 60°C within 5 min (▵) and held at 25°C for 120 h before being reheated to 60°C (○). The solid lines shown in this figure mark the position of the plateau corresponding to the end of prefibrillar aggregate formation and the slopes of the regions corresponding to the period of fibril growth (13), respectively. The nucleation (lag) times for fibril growth can be determined from the times at which the fibril growth slopes intersect the plateau line. The horizontal error bars represent the uncertainty in the fibril nucleation times obtained in each set of experiments and are shown on a single data point in each set for reasons of clarity.

