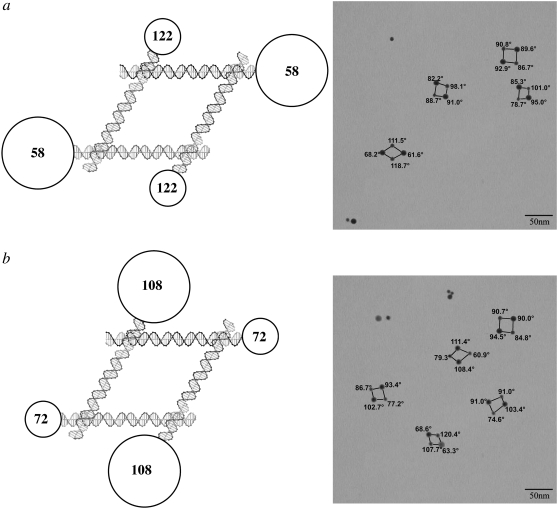
FIGURE 3.
DNA parallelograms with two 5 nm particles and two 10 nm particles. The same conventions apply as in Fig. 2. (a) The 10 nm particles flank acute angles. The bottom image is nearly ideal, but the other images are distorted significantly. (b) The 10 nm particles flank obtuse angles. Distortions are seen in several of the parallelograms, most prominently in the bottom image, where the expected distribution is reversed.

