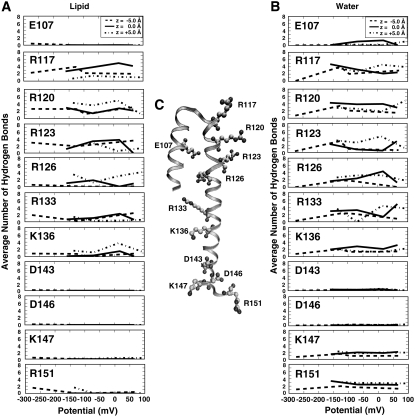
FIGURE 7.
Hydrogen bonds formed by the HTH motif. (A) The average number of lipid hydrogen bonds for each charged residues and z-position as a function of the system electrical potential. (B) The distributions show average number of water hydrogen bonds for each charged residues and z-position as a function of the system electrical potential. (C) The S3b and S4 helices (represented as a ribbon) from the start of simulation. The charged residues are depicted in stick format, with cationic and anionic side chains. (The distribution of the number of hydrogen bonds is shown in Fig. S2 in Data S1.)

