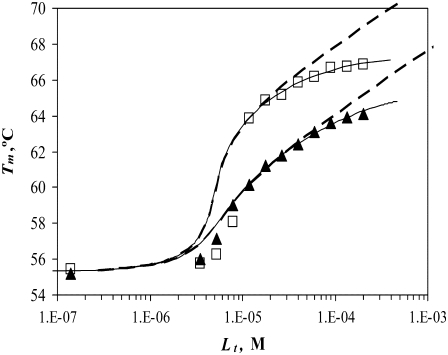
FIGURE 11.
Dependence of the recombinant human carbonic anhydrase II melting temperature on the total added concentration of EZA (□) and TFMSA (▴). Dashed lines represent the fit assuming KbU → 0, Eq. 15, whereas solid lines are fit using Eq. 13. For vanishing  the fitted
  constants have values of
  and
and  M−1 for EZA and TFMSA, respectively. The binding constants (under the condition when
  was allowed to vary) are as follows:
  and
and  M−1 for EZA, and
  and
and  M−1 for TFMSA.

