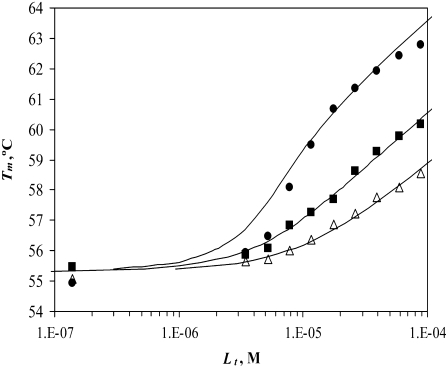
FIGURE 7.
Dependence of the hCAII melting temperature on ligand concentration: AZM (•), 3d (▪), and CARBS (▵). Lines are drawn according to the model of Eq. 13. Regressed values of ligand binding constants ( ) are
) are  and
and  for AZM, 3d, and CARBS, respectively.

