
Figure 1.
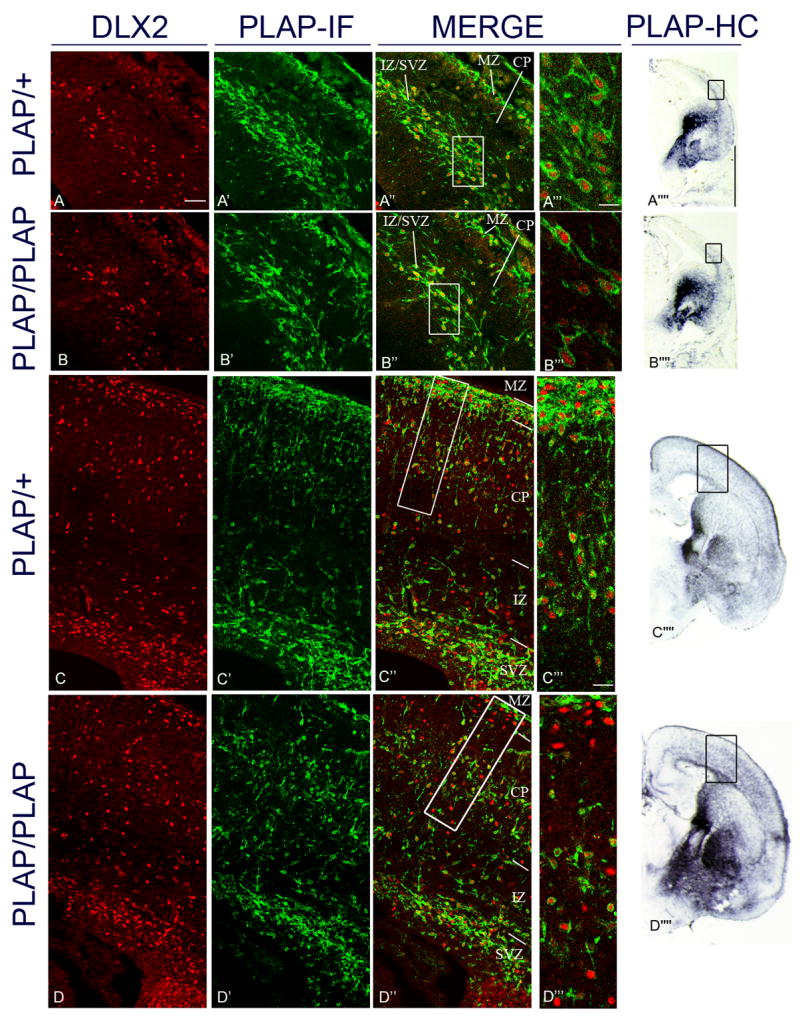
Analysis of Dlx2 and Lhx6 co-expression in the cortex of Lhx6PLAP/+ and Lhx6PLAP/PLAP at E14.5 and E18.5 by immunofluorescence of coronal sections. E14.5 data are shown in panels A–A’’’’ and B–B’’’’ and E18.5 data are shown in panels C–C’’’’ and D–D’’’’. PLAP expression was used to identify Lhx6+ cells. DLX2 immunofluorescence (red; first column); PLAP immunofluorescence (IF) (green; second column); merged (third column); higher magnification of marginal zone and cortical plate (see boxes in A″, B″, C″ and D″)(fourth column). Low magnification views of PLAP expression (histochemically-stained, HC) in telencephalic hemispheres (fifth column); boxed regions correspond to the approximate regions shown in the panels to the left. The boxes in the panels in the third column identify the regions shown at higher magnification in the fourth column. Panels C, C′ and C″ and D, D′ and D″ are composite images from the fusion of 2 images (confocal pictures; 25x objective) from the superficial region of the cortex and the deep region of the cortex.
At E14.5, the mutant has slightly reduced numbers of PLAP+ cortical interneurons compared to the heterozygote (A′ and B′), while at E18.5, the distribution of the PLAP+ cells in the mutant is very abnormal; compare with the heterozygote (C′ and D′). The mutant had very few PLAP+ cells in the superficial layers of the cortex (MZ and superficial layers of the CP). By contrast, the mutant had increased numbers of PLAP+ cells in deep regions of the CP and IZ (C′ and D′). At E14.5, Lhx6PLAP/+ and Lhx6PLAP/PLAP only exhibited interneurons that were Dlx2+;Lhx6+ (A″, A‴ and B″, B‴); whereas by E18.5, there were Dlx2 +;Lhx6− and Dlx2+;Lhx6+. Abbreviations: see Table: 3. Scale bar in A: 50 μm (for A–D, A′–D′ and A″–D″). Scale bar for A‴–B‴: 10 μm; for C‴ and D‴: 20 μm; for A’’’’ and B’’’’: 1mm; for C’’’’ and D’’’’: 1mm. See Supplemental Figure 20 for the magenta-green copy.