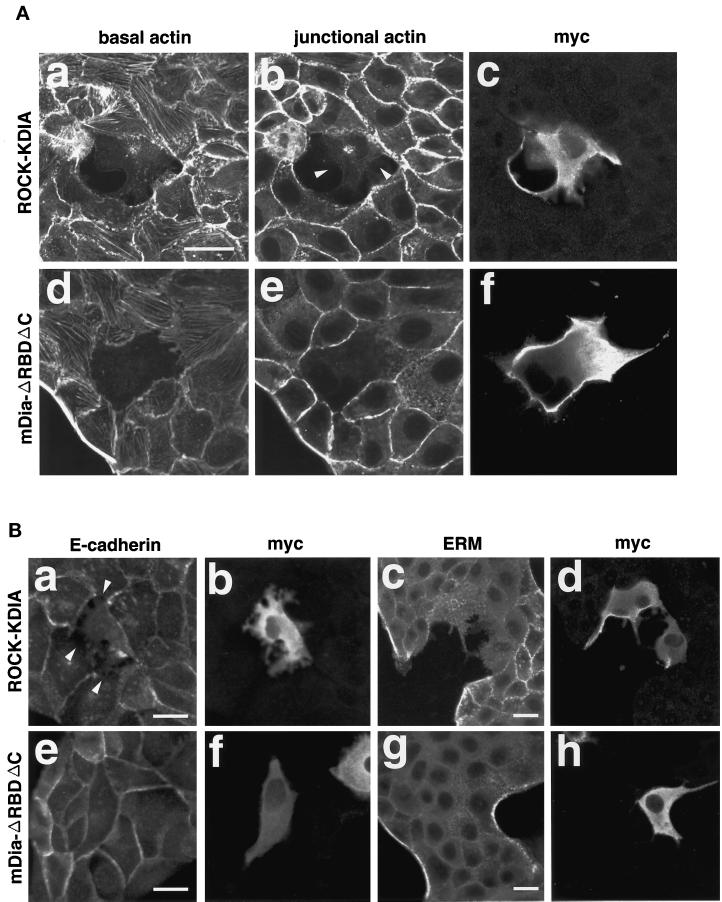
Figure 4.
Effect of the dominant negative mutant of ROCK or mDia on the actin cytoskeleton, E-cadherin, and the ERM family in MDCK cells. (A) pCAG-myc-ROCK-KDIA (a–c) and pEF-BOS-myc-mDia-ΔRBDΔC (d–f) were microinjected into the nuclei of MDCK cells. At 10 h after the microinjection, the cells were fixed and double stained with rhodamine-phalloidin (a, b, d, and e) and the anti-myc mAb (c and f). (a and d) Confocal microscopic analysis at the basal levels. (b, c, e, and f) Confocal microscopic analysis at the junctional levels. (B) pCAG-myc-ROCK-KDIA (a–d) and pEF-BOS-myc-mDia-ΔRBDΔC (e–h) were microinjected into the nuclei of MDCK cells. At 10 h after the microinjection, the cells were fixed and double stained with the ECCD-2 anti-E-cadherin mAb (a and e) and the anti-myc mAb (b and f) or with the anti-ERM family mAb (c and g) and the anti-myc mAb (d and h) and analyzed at the junctional levels using confocal microscopy. The results shown are representative of three independent experiments. Bars, 10 μm. Arrowheads in A, b, indicate the sites where cell–cell adhesion is disrupted. Arrowheads in B, a, indicate the sites where the staining of E-cadherin at the cell–cell adhesion sites disappeared.

