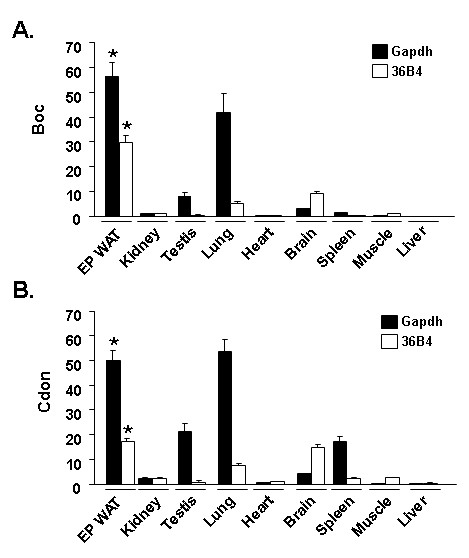
Figure 3.

Tissue distribution of Boc and Cdon transcript expression. qPCR analysis using the Boc (A) or the Cdon (B) primer set. For A and B, data was corrected against Gapdh (black fill) and or 36B4 (white fill) as internal control for qPCR analysis; values stated in the text are the average of the Gapdh-corrected and 36B4-corrected data for each comparison. For A, * indicates p < 0.001 for EP WAT compared with all tissues except the Gapdh-corrected value for lung. For B, * indicates p < 0.001 for EP WAT compared with all tissues except the Gapdh-corrected value for lung and the 36B4-corrected value for brain. For A and B, the level in kidney was set to a value of 1.
