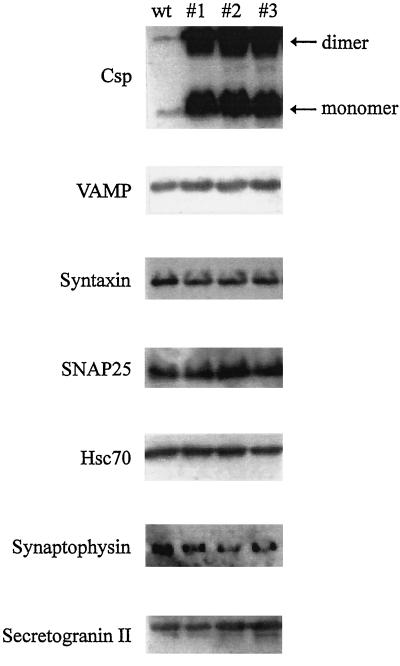
Figure 1.
Analysis of protein expression in control cells and overexpressing clones. Cells (1 × 10⁶) were resuspended in 100 μl of SDS-dissociation buffer. The protein samples were separated by SDS-PAGE on 12.5% polyacrylamide gels and blotted onto nitrocellulose. The expression levels of various proteins were examined by immunoblotting with specific antisera as indicated, and wild-type cells (wt) were compared with three selected overexpressing clones (1–3).

