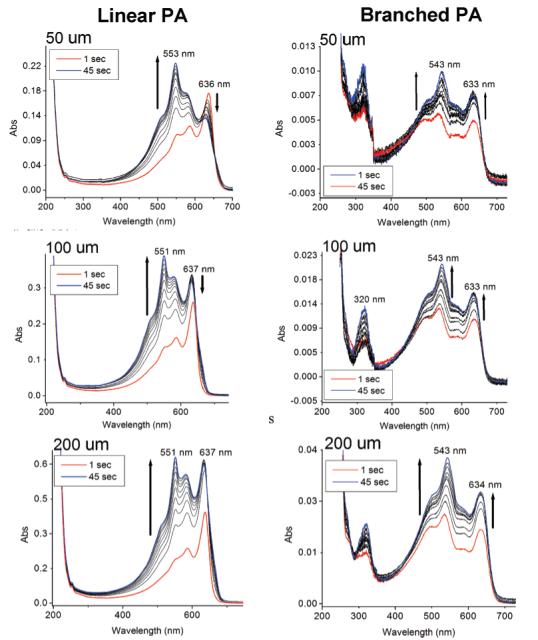
Figure 2.

Time-dependent UV spectroscopy of linear (left) and branched (right) PAs at varying concentrations. Samples were monitored in 5 s time-intervals for 45 s. The spectra also show data of 1 s after irradiation.

Time-dependent UV spectroscopy of linear (left) and branched (right) PAs at varying concentrations. Samples were monitored in 5 s time-intervals for 45 s. The spectra also show data of 1 s after irradiation.