
Figure 3.
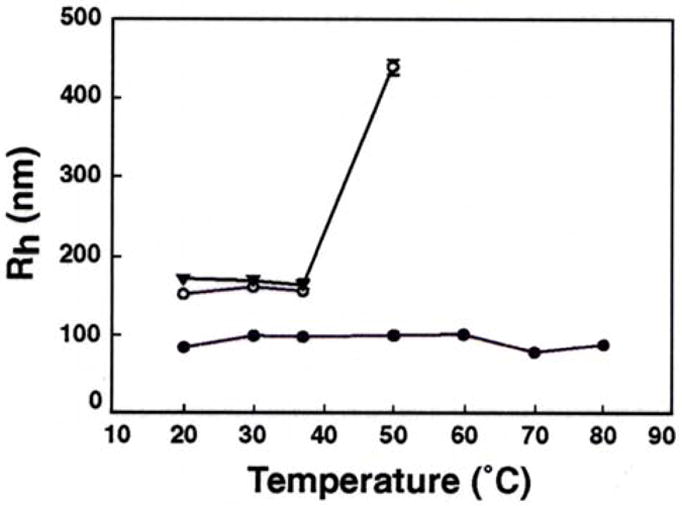
Effect of temperature on hydrodynamic radius (Rh) of λ-DNA nanoparticles. The symbols represent mean Rh values of nanoparticles produced in 100 mM Na cacodylate buffer in the presence of Lys4 (▼), Lys5 (○), and poly-L-lysine (●). Error bars indicate standard deviation from 4–6 separate experiments and are generally of a magnitude to be contained within the symbol.