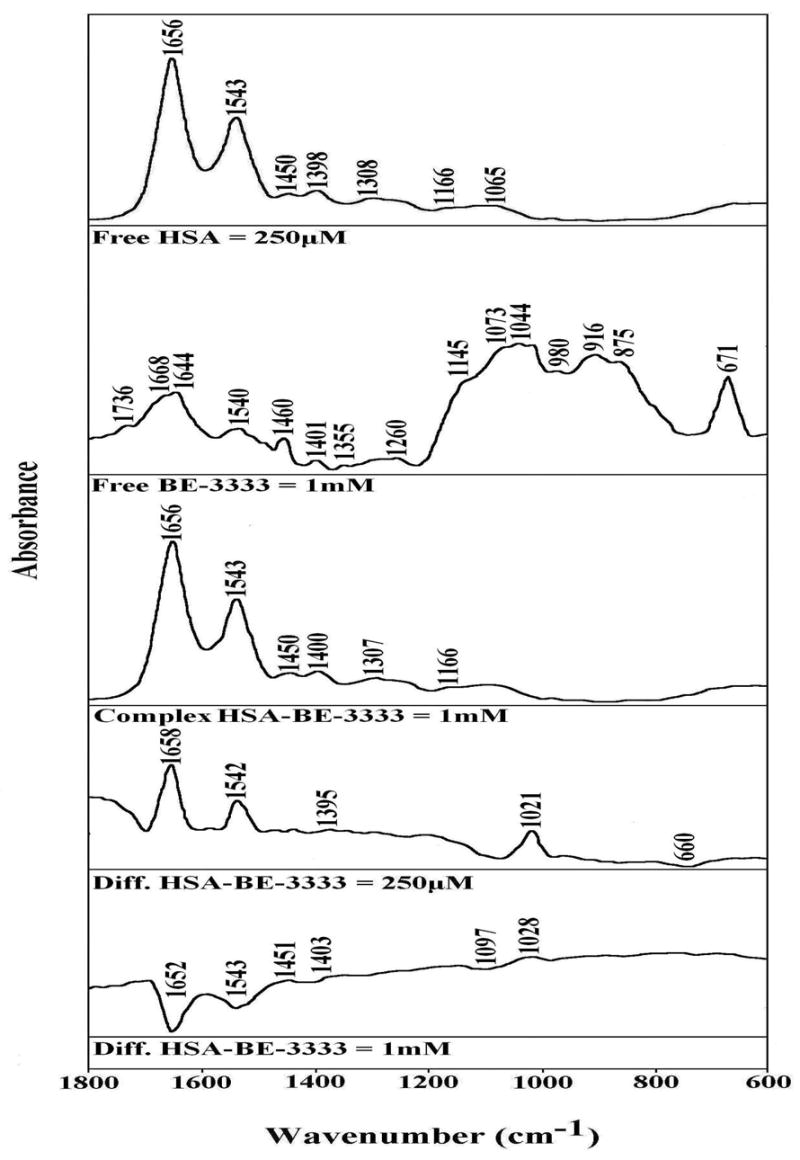
Figure 3.

FTIR spectra in the region of 1800-600 cm−1 of hydrated films (pH 7.2) for free HSA (0.25 mM) and BE-3333-HSA adducts (top three curves) and difference spectra (diff.) of polyamine-HSA complexes (bottom two curves) obtained at different polyamine concentrations (indicated on figure).
