Figure 1.

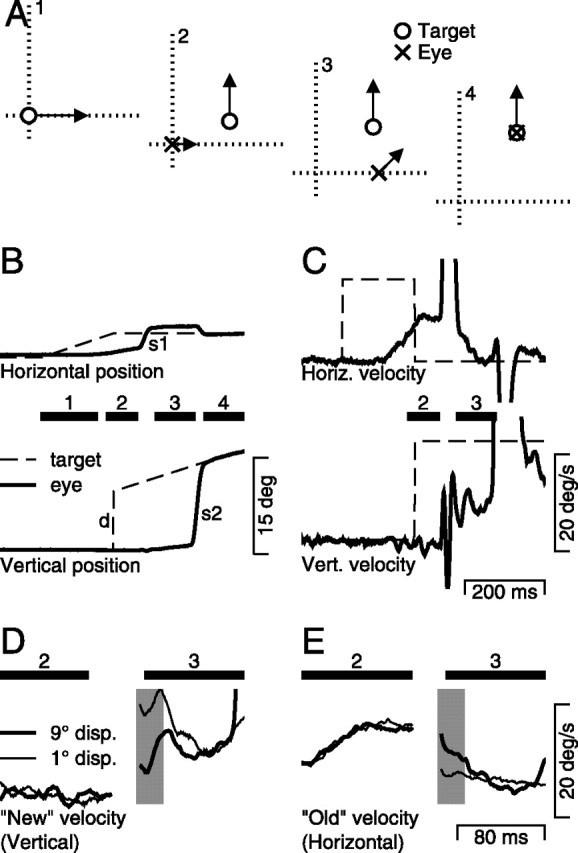
Schematic diagram of the behavioral task and sample responses. A, The task is shown in spatial coordinates as a sequence of four snapshots. In each panel, the open circle and the cross indicate the position of the target and eye. A1, Starting just off fixation point, the target moves to the right at 20°/s. A2, The eye moves rightward in response to the initial target motion, while the target steps up (the “new” position) and begins moving upwards at 20°/s (the “new” motion). A3, The eye makes a rightward saccade driven by the predisplacement location of the target, while the target continues to move up. A4, A second saccade takes the eye directly to the target, which is then tracked appropriately. B, The horizontal and vertical components of eye (solid line) and target (dashed line) positions are plotted as a function of time. Black bars with numbers over them mark the periods corresponding to the schematic in A. The labels “d,” “s1,” and “s2” mark the target displacement to the new position and motion, and the first and second saccades. C, The horizontal and vertical components of eye velocity (solid line) and target velocity (dashed line) as a function of time. The bold, horizontal bars correspond to intervals 2 and 3. D, E, Same data as in C, but with the time base expanded so that data are shown only for intervals 2 and 3. In D and E, the thick and thin lines show responses when the size of the target displacement was 9 and 1°, respectively, whereas the shaded vertical rectangles indicate the interval used for analysis.
