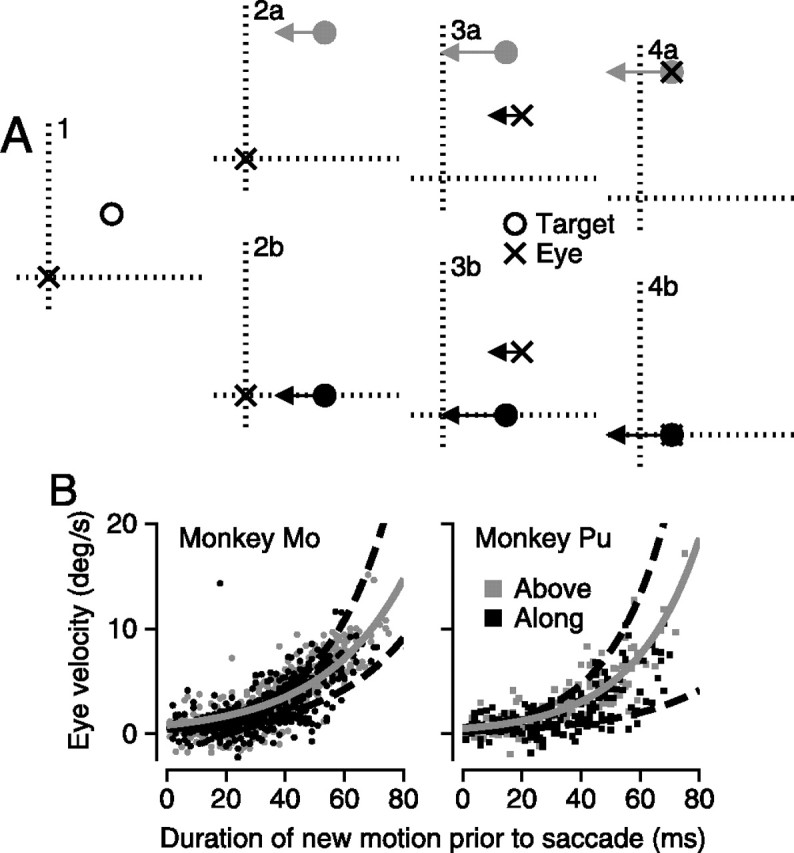
Figure 6.

Analysis of the frame of reference of the relationship between postsaccadic eye velocity and the distance from the endpoint of the saccade to the target position. A, Schematic diagram showing the task as a sequence of four snapshots in time. A1, A stationary target (open circle) appeared 3° above and to the right of the eye (x). A2a,b, The target could follow one of two trajectories. It could step 3° upwards and begin moving to the left, “above” trials indicated by a gray-filled circle. Or it could step 3° downward to the horizontal meridian and begin moving to the left, “along” trials indicated by a black-filled circle. A3a,b, The eye makes a saccade to the original location of the target and begins to move smoothly to the left. A4a,b, The eye makes a saccade to the correct location of the target and continues to track it smoothly. B, Graphs that plot eye velocity as a function of the duration of target motion before the first saccade for two monkeys. Gray and black dots show data from individual trials in which the target stepped so that it moved either above or along the horizontal meridian. The solid gray curves show the exponential fit to the “above” trials, whereas the two dashed black curves delimit the 95% confidence intervals on the fit to the “along” data.
