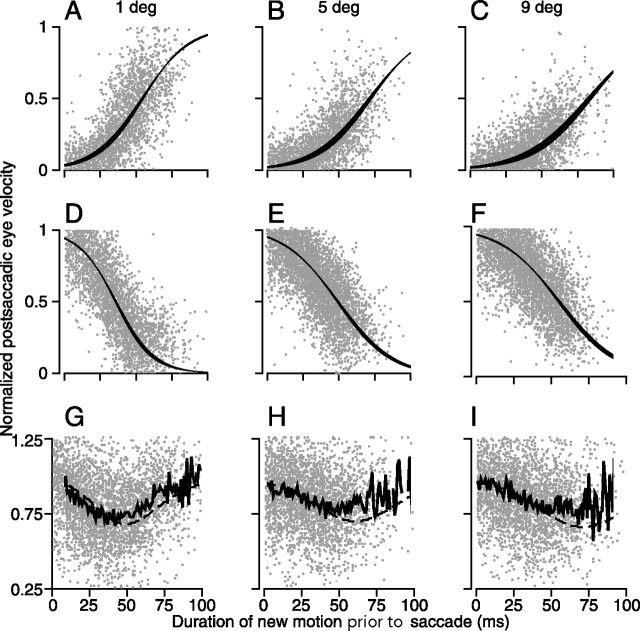
Figure 7.
Temporal dynamics of the modulation of visual-motor transmission for pursuit. All plots show normalized horizontal postsaccadic eye velocity as a function of the duration of new motion before the beginning to the targeting saccade. Normalization was performed relative to the postsaccadic eye velocity on control trials in which a single target moved horizontally. Graphs are grouped by rows, which show a particular type of experiment, and columns, which show data when the displacement of the target was 1, 5, or 9°. In each graph, the tiny gray dots show the responses in individual trials across all four monkeys. A–C, Data from the experiment described in Figures 1–2. Initial target motion was vertical, and the new target motion was horizontal. The graphs plot the time course of the increase in postsaccadic eye velocity in the direction of new motion. D–F, The original direction of motion was horizontal, and the new direction of target motion was vertical. The graphs plot the time course of decay of the response to the old, horizontal target motion. In A–F, the black ribbons show the best fitting sigmoid function with the 95% confidence intervals on the fit. G–I, Data from the experiment diagrammed by open circles in Figure 5A, in which the target underwent a vertical displacement but continued to move horizontally at 20°/s so that the original and new motions were the same. The jagged solid line corresponds to the mean of the data. The dashed line shows the sum of the sigmoid fits from the data in the two graphs directly above each of the bottom graphs.

