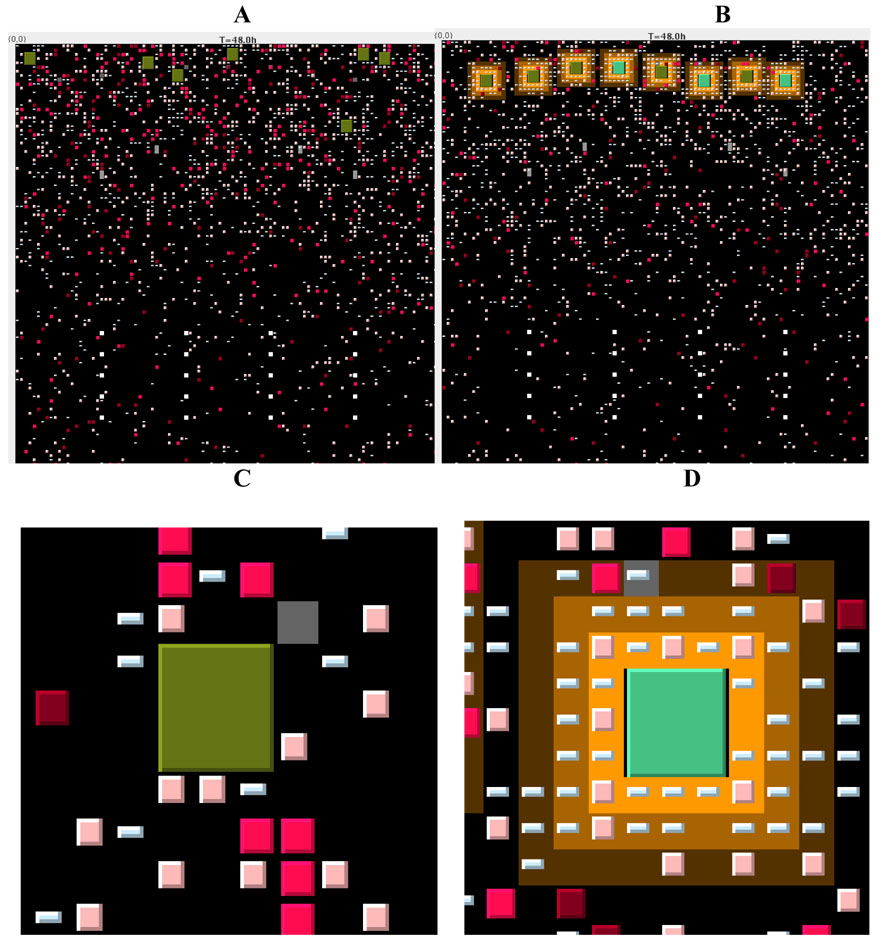
Figure 2. Snapshots of the full grid and zoom figures from our computer simulations taken at 48 hours.
Panel A. The complete layout of the T-zone grid is shown from a snapshot of a simulation at 48 hours after introduction of antigen via DCs (shown as large green squares) under conditions of no chemotaxis. DCs enter near the top of the grid, the T cells enter via HEVs that are placed in an arch about 1/3 of the distance from the top of the grid and later exit via MS that are arranged in rows near the bottom of the grid. CD4+ T cells are shown as squares in shades of pink to red, while CD8+ T cells are shown as rectangles in shades of blue (color shades are described in Figure 1). The chemotactic areas around DCs are shown in yellow.
Panel B. The complete layout of the T-zone grid is shown at 48 hours after introduction of antigen via DCs with chemotaxis.
Panel C. A close-up from panel A shows a DC without chemokine, and few T cells in the local vicinity.
Panel D. A close-up from panel B shows the chemokine area (shades of yellow) around a DC, along with multiple T cells that have been attracted. Note that these simulations and those posted online all use a cognate ratio of 1:10 for purposes of illustrating more activity on the grid. Movies from the simulations are available at: http://malthus.micro.med.umich.edu/LNcode/flash/series/1.html

