
Fig. 6.
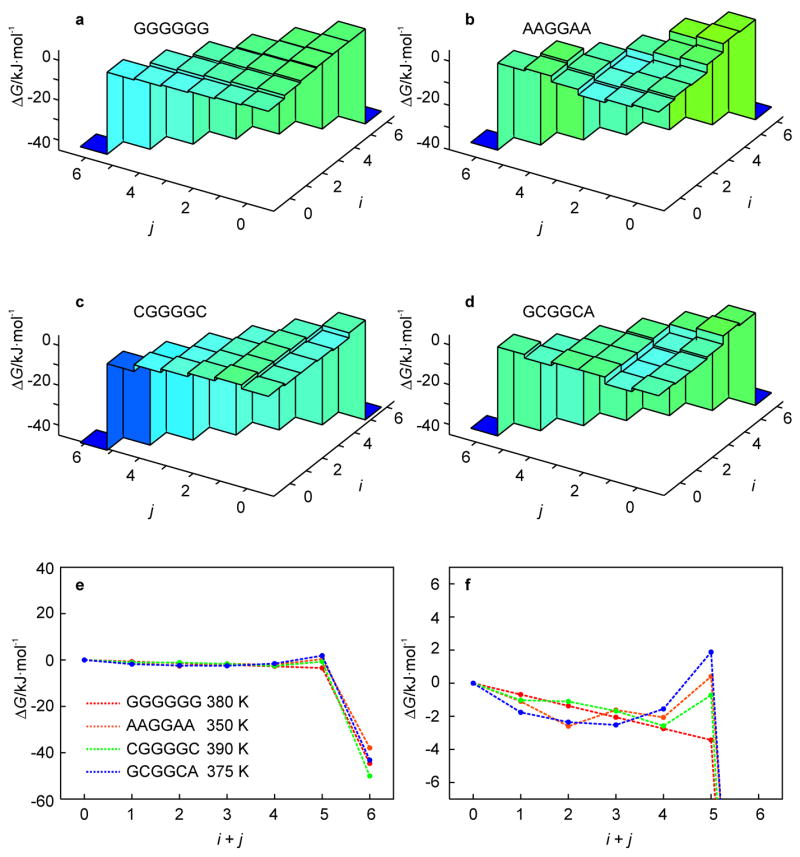
Effect of stem sequence permutations, Fig. 1d–g, of the hairpin of Fig. 1c (n = 13) on the free energy landscape as obtained from the KIS model (a–d). (Un)folding pathways characteristic of the above landscapes are represented by 1D profiles (e). The behavior for i + j < 6 is magnified in the lower right panel to illustrate the change in the unfolding barrier (f).