Figure 1.
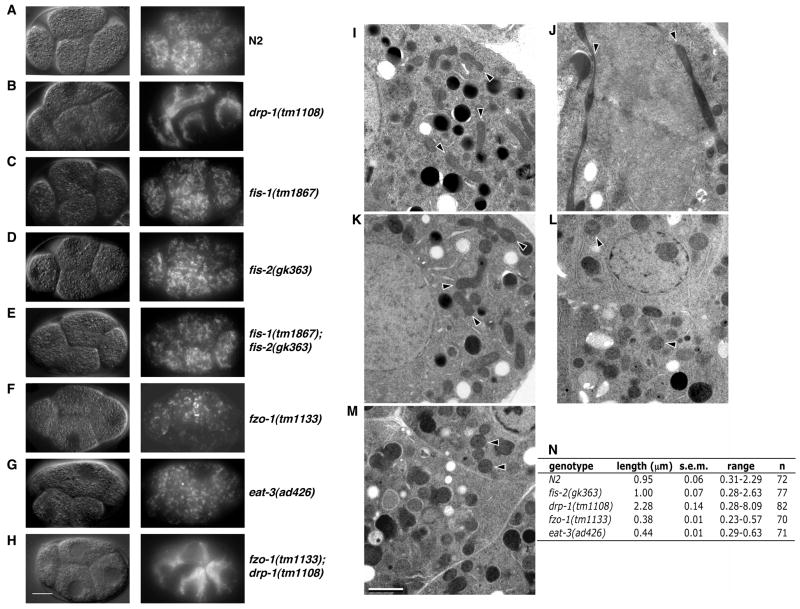
Mitochondrial morphology in mitochondrial fission and fusion mutant embryos. (A–H) Live imaging of mitochondrial morphology. The indicated strains were stained with TMRE and four-cell stage embryos were visualized by Differential Interference Contrast (DIC, left) and rhodamine fluorescence (right) microscopy. Compared with the wild type embryo (A), the mitochondrial network is highly connected in the drp-1(tm1108) and fzo-1(tm1133); drp-1(tm1108) embryos (B, H), indistinguishable from that of the wild type embryo in fis-1(tm1867), fis-2(gk363), and fis-1(tm1867); fis-2(gk363) embryos (C–E), and highly fragmented in fzo-1(tm1133) and eat-3(ad426) embryos (F, G). Scale bar represents 10 μm. (I–M) Representative electron micrographs of embryos from the following strains are shown: N2 (I), drp-1(tm1108) (J), fis-2(gk363) (K), fzo-1(tm1133) (L), and eat-3(ad426) (M). Scale bar represents 1 μM. Arrows indicate the longitudinal axis of mitochondria. (N) Quantification of the mean mitochondrial length. Randomly selected mitochondria from electron micrographs were measured along their longitudinal axis. For each strain, mitochondria were selected from over 10 different embryos inside at least two thin-sectioned gravid adult animals. s.e.m., standard error of the mean. n, the number of mitochondria scored.

