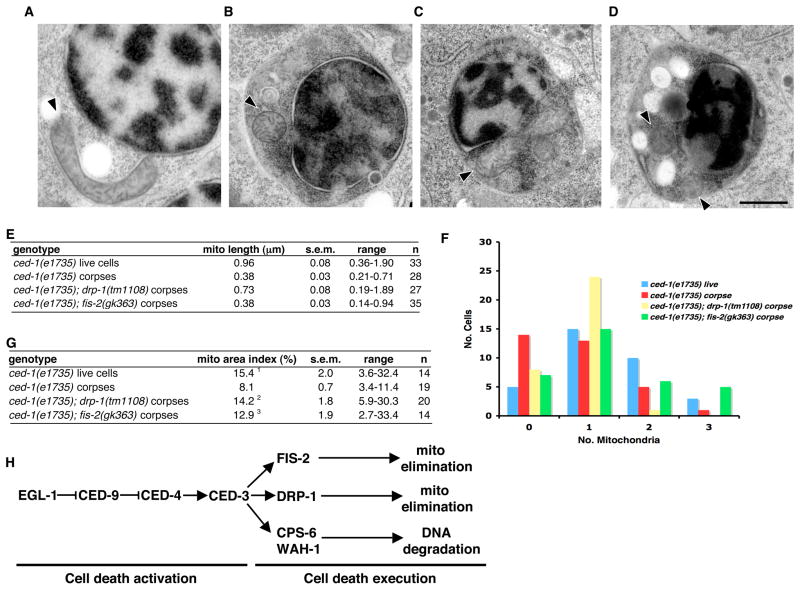
Figure 3.
Electron microscopy analysis of mitochondria in cell corpses of drp-1 and fis-2 mutants. Representative EM micrographs from serial sections of ced-1(e1735) living cells (A), cell corpses in ced-1(e1735) (B), ced-1(e1735); drp-1(tm1108) (C), and ced-1(e1735); fis-2(gk363) (D) 4-fold stage embryos are shown. Arrowheads denote the longitudinal axis of mitochondria. Compared with small, spherical mitochondria seen in ced-1(e1735) and ced-1(e1735); fis-2(gk363) corpses, some larger, elongated mitochondria are seen in the ced-1(e1735); drp-1(tm1108) cell corpses. Scale bar represents 0.5 μm. (E) Quantification of the mitochondrial length in cell corpses. The mean mitochondria length, range of mitochondria length, and standard error of the mean (s.e.m.) are shown. n, the number of mitochondria scored. (F) Quantification of the number of mitochondria in cell corpses. Randomly chosen EM sections of ced-1(e1735) living cells, or cell corpses in the indicated mutant embryos were analyzed and the number of mitochondria in each section was counted (n = 33). Data are shown as the number of cells or cell corpses (Y axis) containing a particular number of mitochondria (X axis). (G) Comparison of the mitochondrial area index. The mitochondrial area index represents the percentage of total mitochondria content within the whole cell. The mean mitochondrial area index, the range of the index, the standard error of the mean (s.e.m.), and the number of corpses scored (n) are shown. Unpaired two tailed t-test, compared with ced-1(e1735) cell corpses: 1P = 4.4×10⁻⁴; 2P = 7.6×10⁻⁴, 3P = 1.1×10⁻². (H) A model for programmed cell death in C. elegans. In cells programmed to die, EGL-1 antagonizes the CED-4-inhibitory activity of CED-9, allowing CED-4 to activate the CED-3 zymogen. Activated CED-3 triggers three independent cell death pathways derived from the mitochondrion, mediated by DRP-1, FIS-2, and CPS-6/WAH-1. Cleavage of DRP-1 by CED-3 is important for DRP-1’s pro-apoptotic function, which may contribute to the removal of mitochondria. FIS-2 may also independently promote the elimination of mitochondria from dying cells. The release of CPS-6 and WAH-1 from mitochondria and translocation to the nucleus triggers apoptotic DNA degradation (Parrish et al., 2001; Wang et al., 2002).

