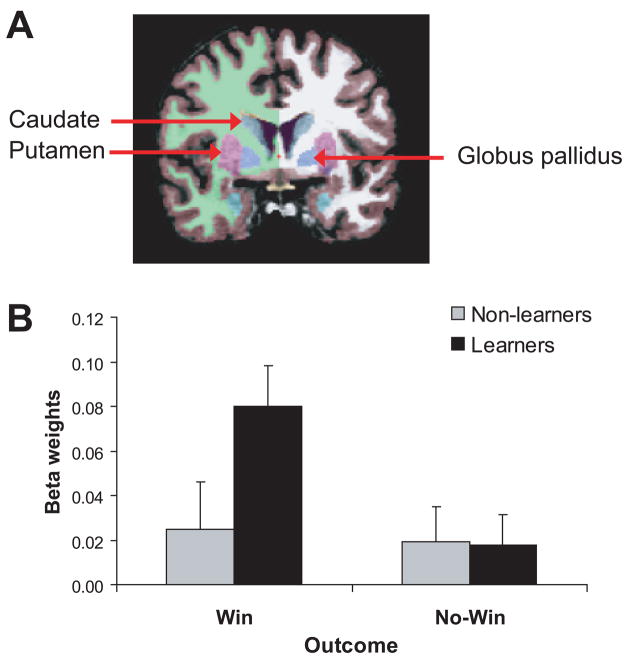
Fig. 4.
(A) Parcellation of basal ganglia structures in a representative participant; only the caudate, putamen, and globus pallidus are shown in this coronal slice. (B) Mean beta weights (averaged across regions and hemispheres) in response to win feedback and no-win feedback in learners and non-learners (significant Group × Outcome interaction). Error bars refer to standard errors.

